[Top][All Lists]
[Date Prev][Date Next][Thread Prev][Thread Next][Date Index][Thread Index]
Re: [Gnumed-devel] How to display your results
|
From: |
Jim Busser |
|
Subject: |
Re: [Gnumed-devel] How to display your results |
|
Date: |
Fri, 08 Jul 2011 02:26:40 -0700 |
On 2011-07-08, at 1:16 AM, Karsten Hilbert wrote:
>> Kirk > Measurements plug-in > select CRP row > "Actions" button > Plot
>> > (on Mac OS ensure installed AquaTerm) > witness visual drop in CRP
>
> That worked. Phew :-)
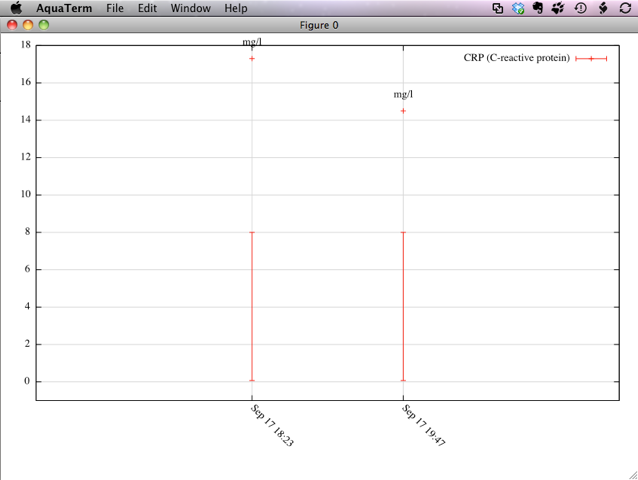
Even better (which I did not realize until I just tried it) the per-result
values, if specified, for
val_normal_min numeric
val_normal_max numeric
but not
val_normal_range (as this is alpha)
will plot. I went into Kirk's values, saw val_normal_range (0.07 - 8) and so
inputted these into val_normal_min and val_normal_max and replotted:
-- Jim
Re: [Gnumed-devel] How to display your results, Karsten Hilbert, 2011/07/07
- Re: [Gnumed-devel] How to display your results, richard terry, 2011/07/07
- Re: [Gnumed-devel] How to display your results, Jim Busser, 2011/07/07
- Re: [Gnumed-devel] How to display your results, Karsten Hilbert, 2011/07/08
- Re: [Gnumed-devel] How to display your results, Jim Busser, 2011/07/08
- Re: [Gnumed-devel] How to display your results, Karsten Hilbert, 2011/07/08
- Re: [Gnumed-devel] How to display your results,
Jim Busser <=
- Re: [Gnumed-devel] How to display your results, Karsten Hilbert, 2011/07/08
- Re: [Gnumed-devel] How to display your results, Jim Busser, 2011/07/08
- Re: [Gnumed-devel] How to display your results, Karsten Hilbert, 2011/07/08
- Re: [Gnumed-devel] How to display your results, Jim Busser, 2011/07/08
- Re: [Gnumed-devel] How to display your results, Karsten Hilbert, 2011/07/08
Re: [Gnumed-devel] How to display your results, Karsten Hilbert, 2011/07/08
Re: [Gnumed-devel] How to display your results, Karsten Hilbert, 2011/07/08
Re: [Gnumed-devel] How to display your results, Karsten Hilbert, 2011/07/08
Re: [Gnumed-devel] Incoming HL7 result microbiology report handling, Jim Busser, 2011/07/06