[Date Prev][Date Next][Thread Prev][Thread Next][Date Index][Thread Index]
Show the figure created by matplotlib in Emacs' frame.
|
From: |
Hongyi Zhao |
|
Subject: |
Show the figure created by matplotlib in Emacs' frame. |
|
Date: |
Thu, 16 Sep 2021 23:04:35 +0800 |
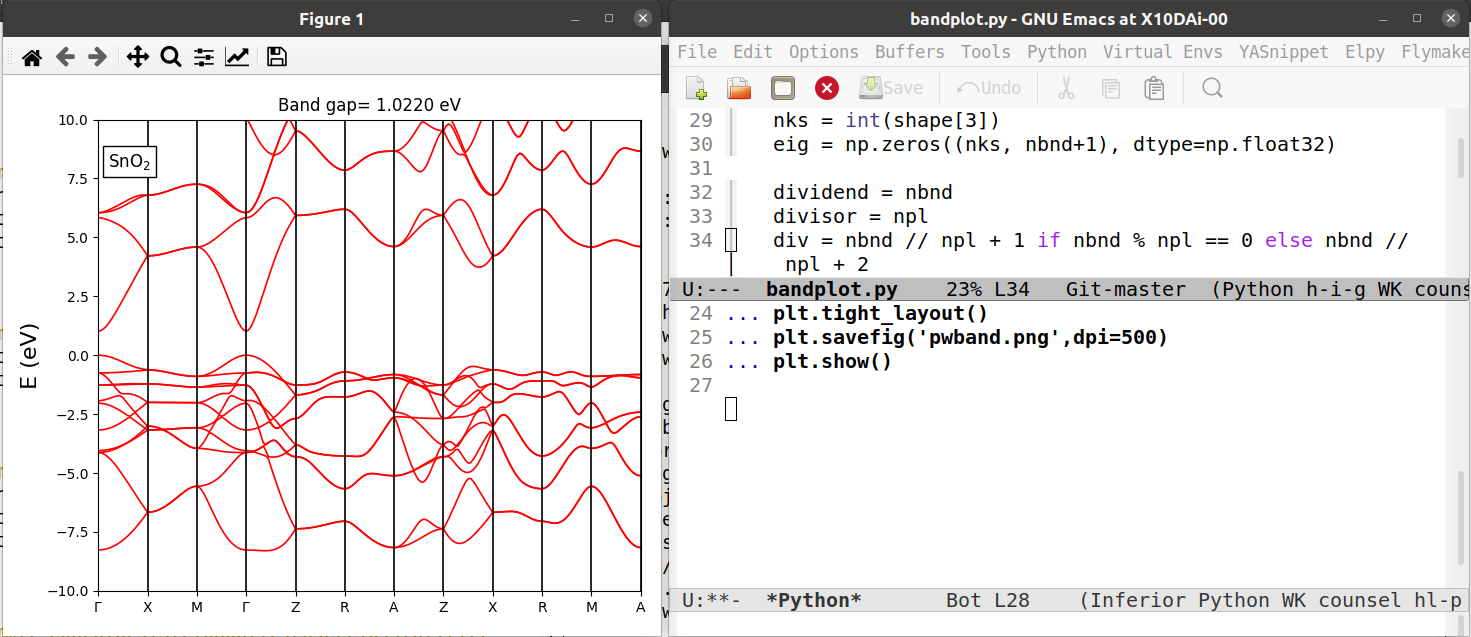
In Emacs, I run the python script [1] using `C-c C-c' provided with
the elpy package. A standalone window will be opened to show the
generated figure, as shown in the attached screenshot file.

But I want to know whether I can let Emacs render the figure in its own frame.

[1] https://github.com/hongyi-zhao/QEbandplot/blob/master/bandplot.py

Any hints will be greatly appreciated.

Regards
--
Assoc. Prof. Hongyi Zhao <hongyi.zhao@gmail.com>
Theory and Simulation of Materials
Hebei Vocational University of Technology and Engineering
No. 473, Quannan West Street, Xindu District, Xingtai, Hebei province
 matplotlib.png
Description: PNG image
- Show the figure created by matplotlib in Emacs' frame.,
Hongyi Zhao <=