[Date Prev][Date Next][Thread Prev][Thread Next][Date Index][Thread Index]
fltk - last plot in a series is incorrect
|
From: |
Terry Duell |
|
Subject: |
fltk - last plot in a series is incorrect |
|
Date: |
Thu, 28 Feb 2013 15:00:38 +1100 |
|
User-agent: |
Opera Mail/12.14 (Linux) |
Hello All,
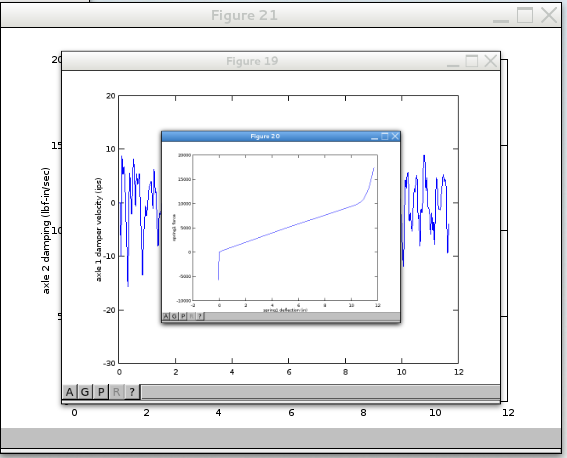
Trying the fltk graphics, with a script that works OK with gnuplot, leaves
the last figure obscured by smaller versions of earlier figures, as shown
in the attached pic.
The smaller figures are not selectable, only figure 21 can be selected.
Figures 19, 20 have already been plotted as separate figures. Only the
last, figure 21 is displayed in this obscured manner.
I am running Octave 3.6.3, Fedora 18 x86_64.
Is this a known problem?

Cheers,
--
Regards,
Terry Duell
 fltk-graphics.png
Description: PNG image
- fltk - last plot in a series is incorrect,
Terry Duell <=