Hi,
I'm a student and using octave for my tests and plotting.
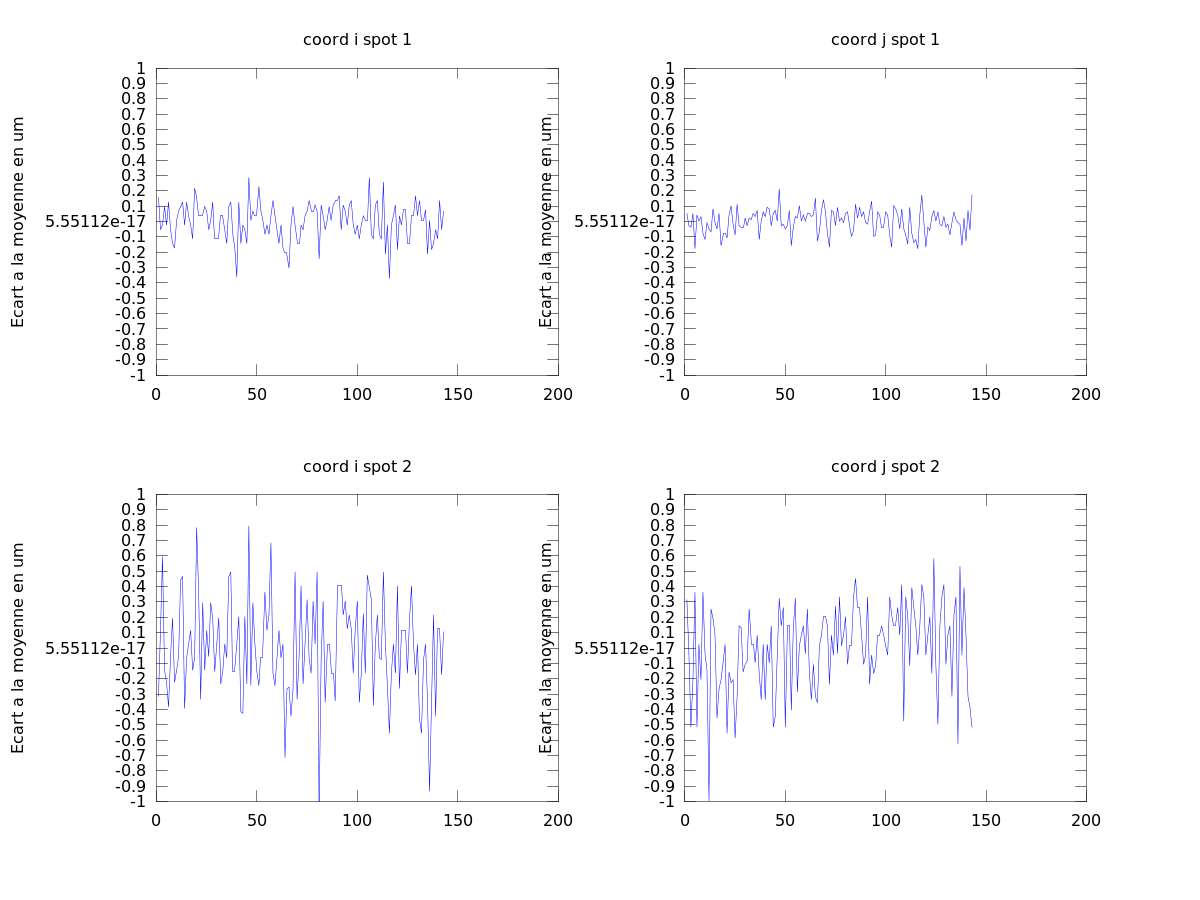
I have this problem while plotting a figure When I force the intervalle of scale, Octave don't put the number '0' but a '5....e-17' in the graphic.
here is an example of the code for plotting :
figure(1)
subplot(221)
hold on
plot(x_img1_c1*1e6-mean(x_img1_c1)*1e6)
title("coord i spot 1")
ylabel("Ecart a la moyenne en um")
set(gca,'ylim',[-1 1],'ytick',-1:0.1:1)
hold off
I don't know how can I fix this problem. It's not convinent for the professionnal graphics to have this value instead of 0. Here is an exemple in the file attached of the result.
Thank you for your help.
Best regards,
Mehdi