On Aug 26, 2013, at 7:12 AM, Lester Anderson wrote:
Hello all,
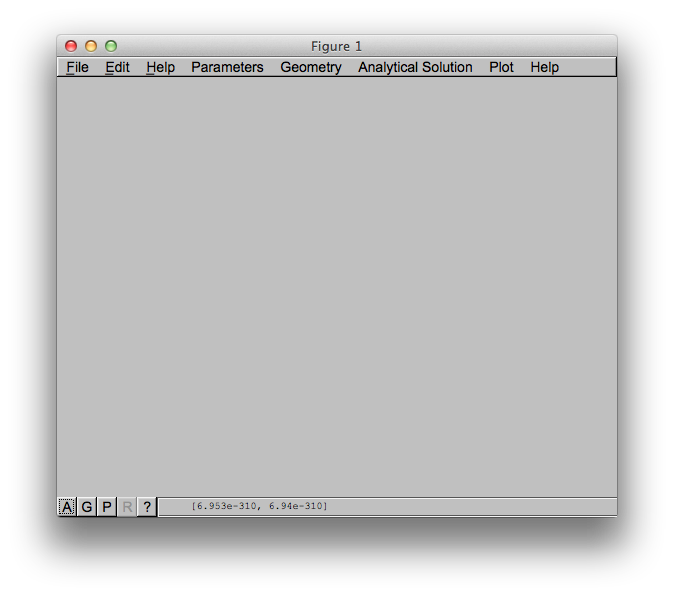
I have some Matlab code that computes a number of geophysical/flexural parameters and should plot the data out. However, the front-end code to the functions does not do anything other than generate a blank figure window: The code below is the top level program that calls the function from the HM_ variables
%program flex2d
%defining variables
global flagelas
global flagtyp
global flaggeom
global flaghede
global flagsol
global flagfig
flagelas=0;
flagtyp=0;
flaggeom=0;
flaghede=0;
flagsol=0;
flagfig=0;
%setting the graphical user interface
canvas = figure('Name','FLEX2D'); <------ this works and the figure window opens, then that is it !
%------------------------------------------------------------------------
HM_par = uimenu(gcf,'Label','Parameters');
HM_parmec = uimenu(HM_par,'Label','Elastic properties', 'Callback', 'elas');
HM_parana = uimenu(HM_par,'Label','Type of analysis','Callback','tanal');
HM_geom = uimenu(gcf,'Label','Geometry');
HM_geomlo = uimenu(HM_geom,'Label','Load geometry','Callback','geom');
HM_geomde = uimenu(HM_geom,'Label','Heights and Densities of loads','Callback','hdens');
HM_geomfi = uimenu(HM_geom,'Label','Read loads from file','Callback','refile');
HM_sol = uimenu(gcf,'Label','Analytical Solution');
HM_solbe = uimenu(HM_sol,'Label','Solve','Callback','solbeams');
HM_solres = uimenu(HM_sol,'Label','Model Results','Callback','results');
HM_plot = uimenu(gcf,'Label','Plot');
HM_plotin = uimenu(HM_plot,'Label','Undeformed Topography','Callback','undef');
HM_plotout = uimenu(HM_plot,'Label','Deformed Topography','Callback','defor');
HM_help = uimenu(gcf,'Label','Help');
HM_helpab = uimenu(HM_help,'Label','About Flex2d','Callback','boxabout');
HM_helpbox = uimenu(HM_help,'Label','Help','Callback','boxhelp');
%-----------------------------------------------------------------------------
All the highlighted function in bold exist in the run folder so that is not the problem (yet)
All of the HM_xxx have attributed values, so I assume it is actually doing something. But the calls to the functions in the uimenu are not run/active. Is there anything wrong or is there a different methodolgy to follow for Octave?
Cheers
Lester
close all
graphics_toolkit fltk
Ben