Good evening,
Please find attached the graph I get with the following code:
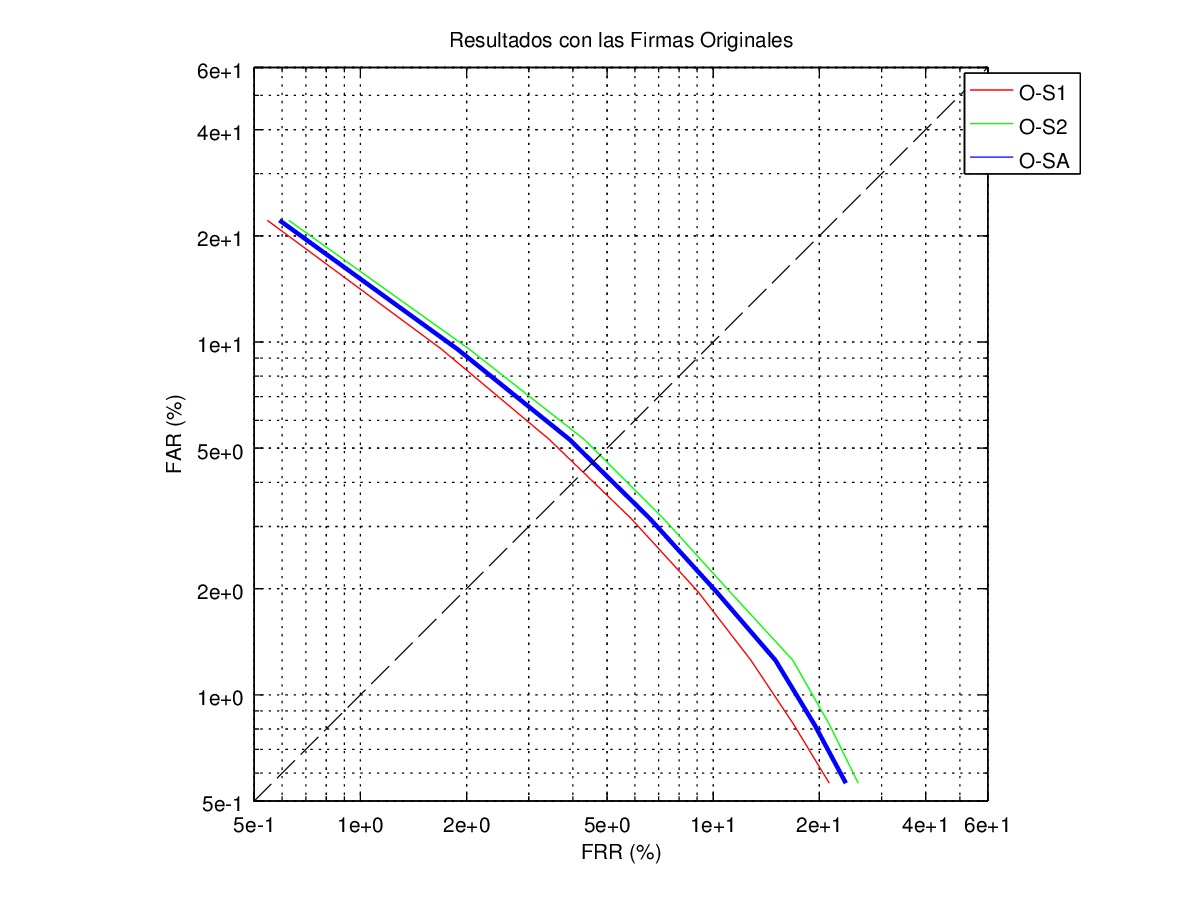
figure(2);
loglog(FRRP,FARP,'r',FRRS,FARS,'g',FRR,FAR,"color",'b',"linewidth",2,x,y,"color",'k',"linestyle",'--');
axis([0.5,60,0.5,60],"square");
set(gca,'xtick', [0.5 1 2 5 10 20 40 60]);
set(gca,'ytick', [0.5 1 2 5 10 20 40 60]);
title(title2); legend('O-S1','O-S2','O-SA'); xlabel('FRR (%)'); ylabel('FAR (%)'); grid('on');
print(nombreGrafica2, "-color", "-dpng");
The problem is that I do not want cientific notation for the numbers in the axis. I want the set of numbers exactly how I indicate in the code: 0.5 1 2 5 10 20 40 60.