Description: PNG image
|
| From: | Matias Senger |
| Subject: | fir1() unexpected results |
| Date: | Mon, 15 Jun 2015 20:41:18 -0300 |
|
Hello,
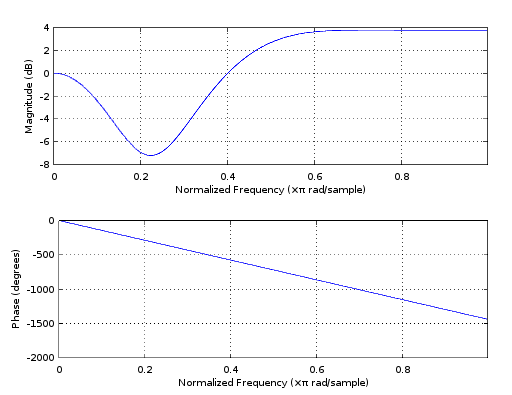
I am using Octave for a project at university in which I am asked to design a bandpass filter. When I call fir1() the designed filter is not what expected. I have run the same command in Matlab (i.e. used fir1() in Matlab) and the designed filter is correct. I do not know if the problem is in my current version of the signal package (signal-1.2.2) because if I run the examples that are in here http://octave.sourceforge.net/signal/function/fir1.html I get different results (in particular in the bandstop examples). When I run freqz(fir1(15,[0.2, 0.5], 'stop')); I get the same warning but the plot is different (see attached file). The magnitude in dB ends at 4 for me and not at 0 as it should (I mean when the normalized frequency is at 1). |
![]() fir1.png
fir1.png
Description: PNG image
| [Prev in Thread] | Current Thread | [Next in Thread] |