On Jul 10, 2015, at 10:20 PM, Thomas D. Dean <address@hidden> wrote:
On 07/10/15 18:57, Doug Stewart wrote:
On Fri, Jul 10, 2015 at 9:25 PM, tmacchant <address@hidden
<mailto:address@hidden>> wrote:
xx and yy is generated by u and v so that they are not appropriate
for mesh
seeing gnuplot example. Questioner wants plot against X and Y mesh.
I am writing from my smart phone and I cannot use octave.
Tatsuro
try #2
[xx,yy]=meshgrid(real(X),real(Y));
Z=z(xx,yy);
mesh(xx,yy,real(Z))
Thanks, Doug. This does not resemble the gnuplot demo. This is the surface of a 3d solid.
Try the example directly into gnuplot.
Tom Dean
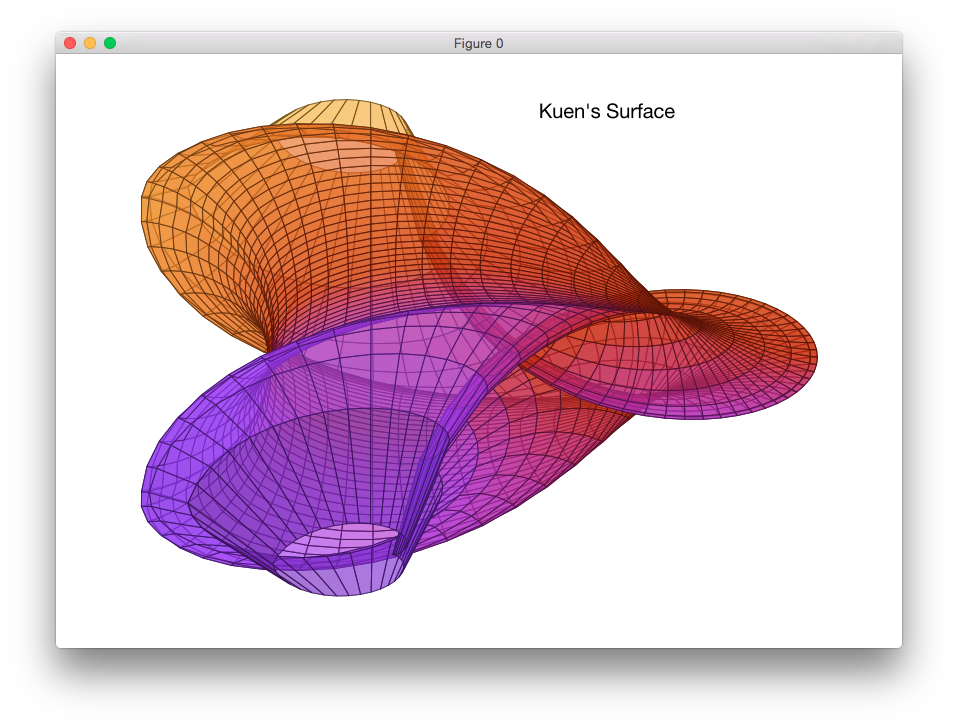
I don’t think Octave is able to render a parametric surface.
The plot rendered by gnuplot is attached for those interested.
Ben