[Date Prev][Date Next][Thread Prev][Thread Next][Date Index][Thread Index]
Subplots with Gnuplot: Two y-axes?
|
From: |
Martin Kunz |
|
Subject: |
Subplots with Gnuplot: Two y-axes? |
|
Date: |
Tue, 25 Aug 2015 11:36:26 +0200 |
|
User-agent: |
Mozilla/5.0 (Windows NT 6.1; WOW64; rv:38.0) Gecko/20100101 Thunderbird/38.1.0 |
Hi,
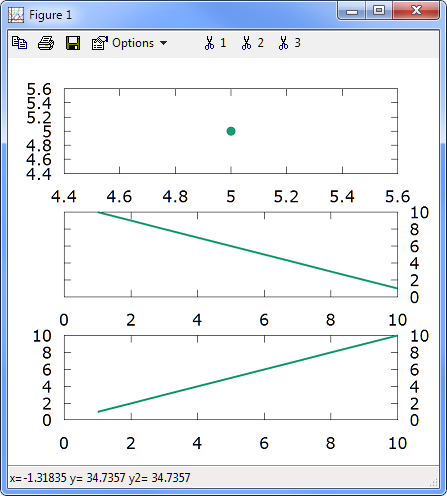
I would like to create a column of three subplots where the second plot
has its y-axis on the right-hand side. Example code:
graphics_toolkit ("gnuplot");
figure(1)
clf;
hAx(1) = subplot(3,1,1);
plot(5,5);
hAx(2) = subplot(3,1,2);
plot(10:-1:1);
hAx(3) = subplot(3,1,3);
plot(10:20)
set(hAx(2),"yaxislocation","right")
For some reason the third plot has a correct y-axis on the left side,
but additionally the y-axis of the second plot on the right (see
attached screenshot). Scrolling in the third subplot vertically moves
both y-axes, so they seem to belong to one axis object, not two on top
of each other.
I cannot even find the duplicate yticklabels:
>> get (1,"children")
ans =
-201.90
-207.46
-213.86
鉢>> get(get(1,"children")(1),"yticklabel")
ans =
{
[1,1] = 10
[1,2] = 12
[1,3] = 14
[1,4] = 16
[1,5] = 18
[1,6] = 20
}
(Note that the first child of the figure is the lowest axis object)
Is this a bug in Gnuplot? Do you have any ideas for a workaround?
I am using Octave 3.0.0-rc4 under Windows 7 with the bundled Gnuplot 4.6
binary.
Thanks for any help!
Martin
 subplotAxisLocationScreenshot.png
Description: PNG image
- Subplots with Gnuplot: Two y-axes?,
Martin Kunz <=