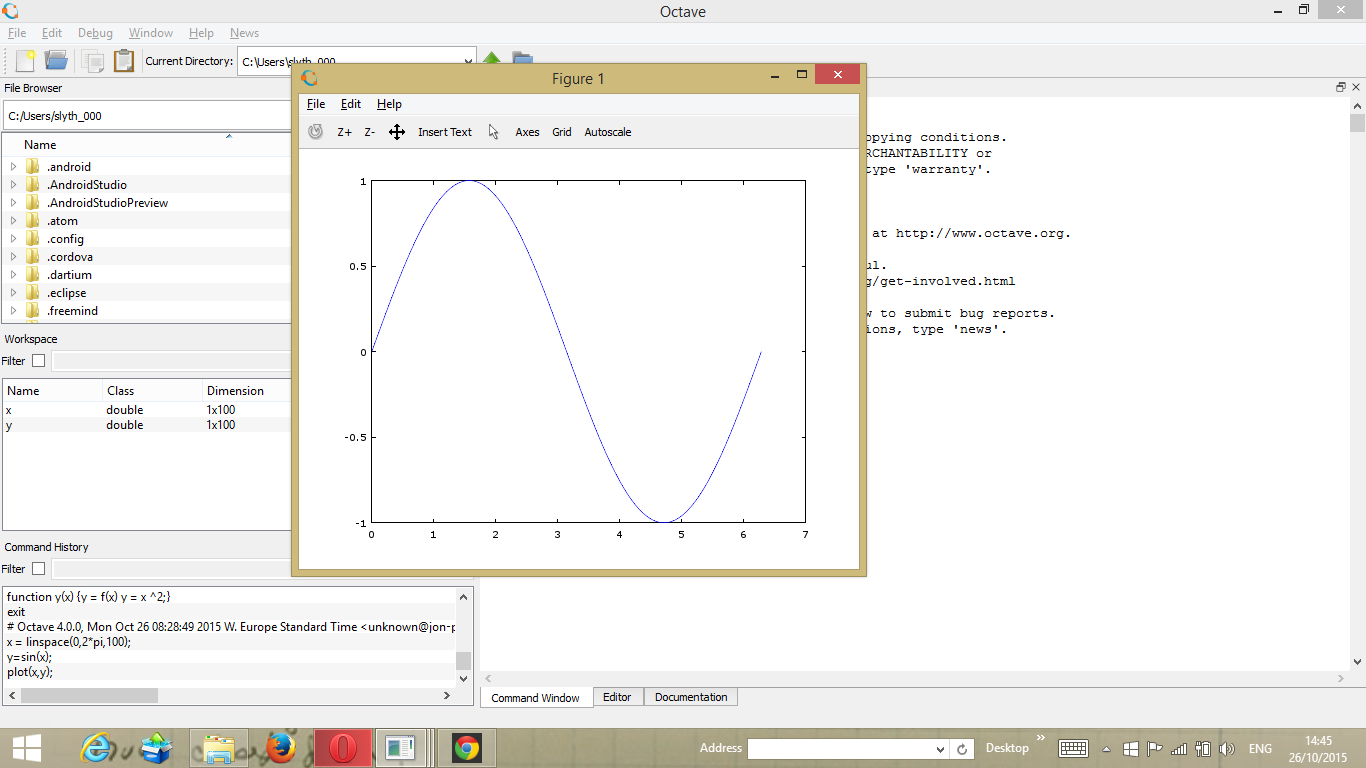
|
From: | Jonathan Camilleri |
Subject: | Re: Octave 4 - Plot Problem |
Date: | Mon, 26 Oct 2015 14:48:59 +0100 |
Hi
I am a totally new user and have just installed Octave 4 as a trial. I am going through some of the early examples from Wiki Books and the arithmetic functions work well but when I come to trying a simple plot the “figure window” opens but no data is displayed and the window “freezes” before the system crashes. No information on why.
The code is very simple and from Wiki Books:
x = linspace(0,2*pi,100);
y=sin(x);
plot(x,y);
figure;
I have tried the GUI version 4.0 and also the command line version both fail at the point of executing the call to “plot” when the “figure” window displays with no plot.
I’m not sure if it is the installation or a configuration issue. I’m using window 7 and Java version 8 – both updated in the last few days.
Any help would be appreciated.
Derek
Dr Derek Dickens
Mobile: +44 (0) 7765 242 948
_______________________________________________
Help-octave mailing list
address@hidden
https://lists.gnu.org/mailman/listinfo/help-octave
[Prev in Thread] | Current Thread | [Next in Thread] |