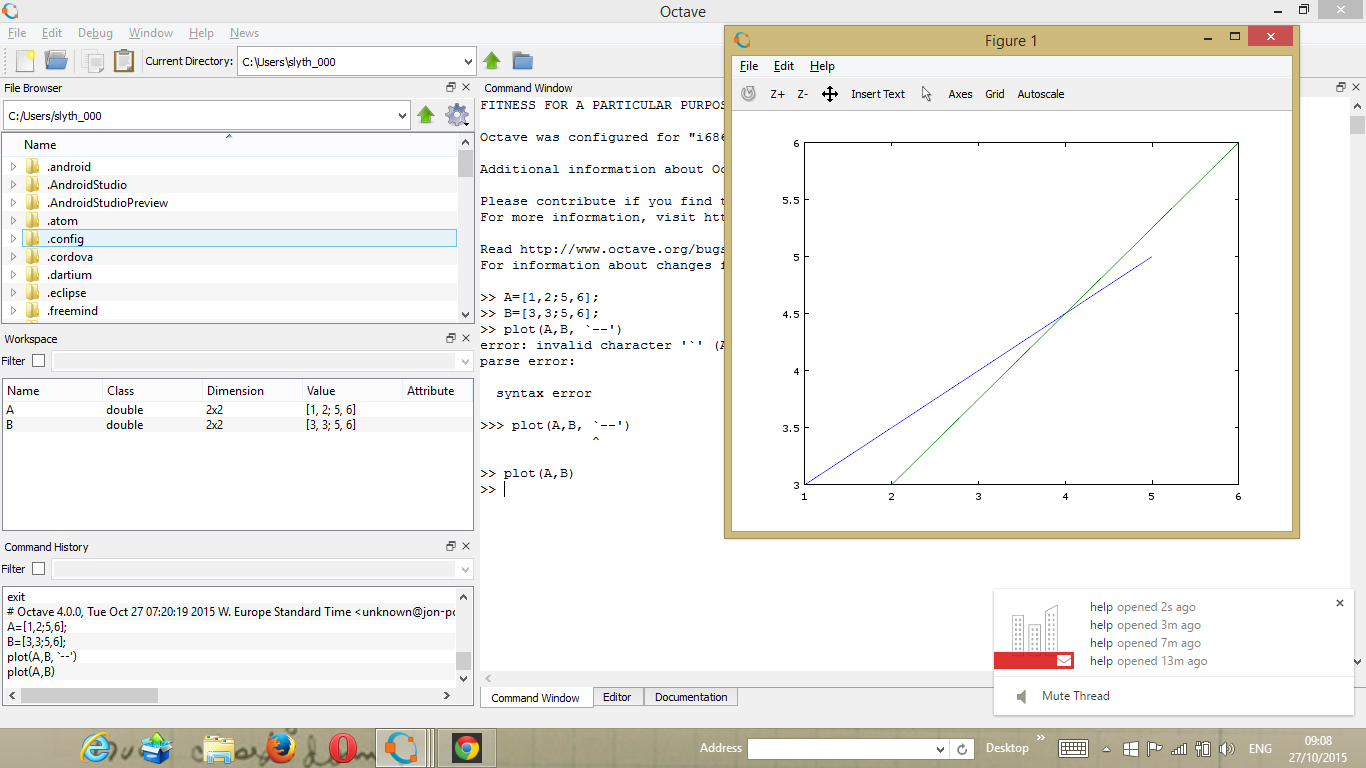
Command line:
>> A=[1,2;5,6];
>> B=[3,3;5,6];
>> plot(A,B, `--')
error: invalid character '`' (ASCII 96) near line 1, column 12
parse error:
syntax error
>>> plot(A,B, `--')
^
>> plot(A,B)
>>
Using windows/CLI
I get the impression by reading the plot help that I can specify a format however again something must be wrong in my understanding of the FMT parameter.
Jonathan Camilleri
Mobile (MT): ++356 7982 7113
E-mail: address@hidden
Please consider your environmental responsibility before printing this e-mail.
I usually reply to emails within 2 business days. If it's urgent, give me a call.
Mobile (MT): ++356 7982 7113
E-mail: address@hidden
Please consider your environmental responsibility before printing this e-mail.
I usually reply to emails within 2 business days. If it's urgent, give me a call.