From: address@hidden [mailto:address@hidden] On Behalf Of Nicholas Jankowski
Sent: Monday, November 09, 2015 12:40 PM
To: Dekome, Kent F. (JSC-ER611)
Cc: address@hidden
Subject: Re: Cant do simple XY plot
On Mon, Nov 9, 2015 at 12:11 PM, Dekome, Kent F. (JSC-ER611) <address@hidden> wrote:
> Installed the 4.0.0.0 on Windows 7 to test its ability to handle
> Matlab mat files...
>
> Loaded my test file and all data vectors are showing up, yet when I
> try to do a simple XY plot the figure window remains blank…
>
>
>
> I can plot the X and Y vector independently, but nothing happens when I do:
>
>
>
> plot( HERA_TLM_T_EngineeringData_TIMETAG,
> HERA_TLM_T_EngineeringData_LastiLoadID)
>
>
>
> I also tried wrapping the last vector with “double” since it is loaded
> as “int16”…same result. Both these vectors are 102 x 1…
>
>
>
> plot( HERA_TLM_T_EngineeringData_TIMETAG,
> double(HERA_TLM_T_EngineeringData_LastiLoadID))
>
>
>
> Whats the probably obvious problem?
>
>
Can you share a sample of the data as it looks after loading into Octave?
From: Dekome, Kent F. (JSC-ER611) <address@hidden>
Date: Mon, Nov 9, 2015 at 1:45 PM
Subject: RE: Cant do simple XY plot
To: Nicholas Jankowski <address@hidden>
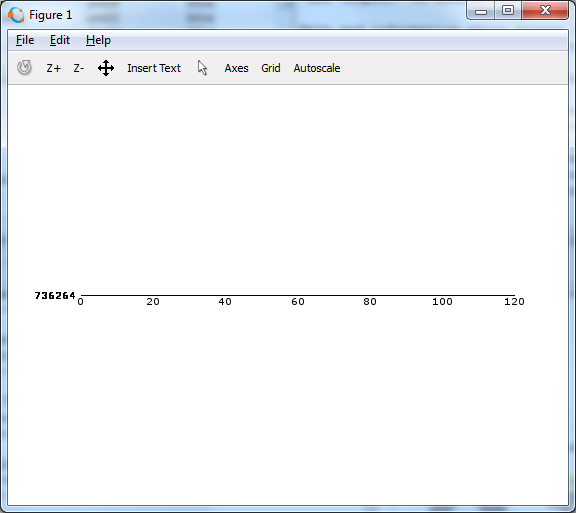
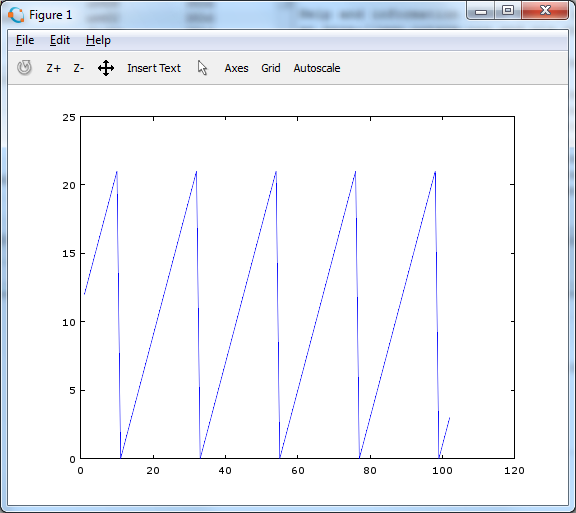
Actually, here’s the plotting of the two vectors, I’m not sure why the first is displaying as it is, instead of a ramp…its actually already been converted to “datenum” by the generating app…
Autoscale has no effect…
<snipped graphic showing time vector is array of 7.3628e5... numbers from datenum)
-Thanks for the detail Kent. Try to keep the mailing list in the conversation, and reply at the end to make it easier for others to follow the thread. Including your message and screenshots above.
Pretty sure your first graph is due to the timestamp magnitude. try generating an alternative x vector, one in seconds or a relative time.
>> newtimevector = HERA_TLM_T_EngineeringData_TIMETAG - now
The little script below shows the difference:----------------
xvec = zeros(1,10000);
for idx1 = 1:10000
xvec(idx1) = now;
for idx2 = 1:100
idx1+idx2; %(time delay loop)
endfor
endfor
plot(xvec);
figure
plot(xvec-now);
----------------
At first I thought it might have to do with data numbersize limits (single precision vs double) but I think the plot routine is just trying to maintain an absolute scaling for both x and y axes including 0, which makes the time vector look like a flat line when plotted alone, and all the data crowds together at the right limit for x,y data:
----------------
figure
plot(xvec, sin(xvec))
figure
plot(xvec-now,sin(xvec))
----------------
Do you have access to compare this to Matlab output for similar datasets? It may be that Octave's current plotting routines need some tweaking.
Nick J.