Description: PNG image
|
| From: | Oliver Heimlich |
| Subject: | Re: Fitting multiple datasets to "partially" the same model (global fit with shared parameters) |
| Date: | Tue, 8 Dec 2015 12:11:54 +0100 |
| User-agent: | Mozilla/5.0 (X11; Linux x86_64; rv:38.0) Gecko/20100101 Icedove/38.4.0 |
On 08.12.2015 10:31, Olaf Till wrote:
> On Mon, Dec 07, 2015 at 07:27:33AM -0800, JokerOne wrote:
>> Yes, my explanation was not precise.
>>
>> Indeed, the knowledge I was talking about is about the *values* of the
>> parameters.
>>
>> So, indeed, the model function(s) for the dataset 1 to n should be noted, in
>> my example, like:
>>
>> F_1(x) = (a0_1*ln(x)) * (b1 + b2*x) for dataset 1
>> F_2(x) = (a0_2*ln(x)) * (b1 + b2*x) for dataset 2
>> ...
>> F_n(x) = (a0_n*ln(x)) * (b1 + b2*x) for dataset n
>>
>> With "unique" a0_i for all datasets and common parameters b1, b2. Now, the
>> fitting procedure could be performed simultaneously, I guess. At least, if
>> this should be of some use?
>>
>> I hope that clarifies my question.
>
> If I understand you right, both the a0_i and the b1, b2 are to be
> determined by fitting, but the a0_i affect only the fit within a
> specific dataset each.
…
> There is currently no general optimization algorithm in Octave which
> does this automatically, by mapping parameters to datasets. (Maybe in
> your special case you can use the upcoming routine Oliver told you
> about, I don't know.)
Yes, this is also possible. You could use the following function for set
inversion and then operate on a larger parameter space:
function y = F (a1, …, aN, b1, b2)
A = [a1; a2; ...; aN];
X = [x_1; x_2; ...; x_n];
y = A .* log (X) .* (b1 + b2 .* X);
endfunction
However, depending on the size of your parameter space it is wise to get
familiar with interval arithmetic and provide a “contractor” to speed up
the algorithm. That is, your function will also compute refinements for
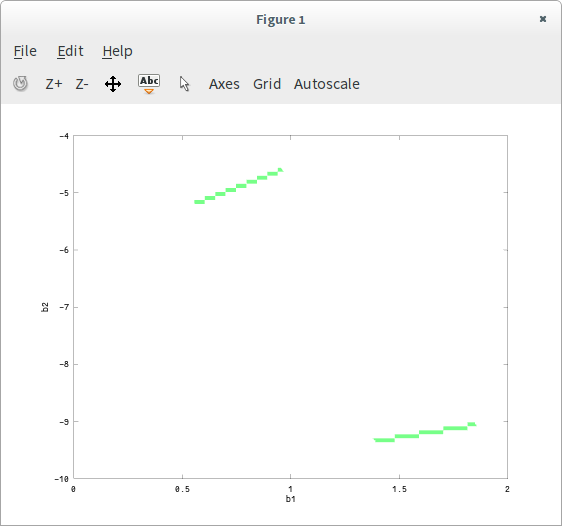
its parameters. Please find a script attached, which does this kind of
search for 5 parameters. The script takes 5 seconds on my notebook. The
plotting shows that the parameter space can be separated into b1 < 1 and
b1 > 1.
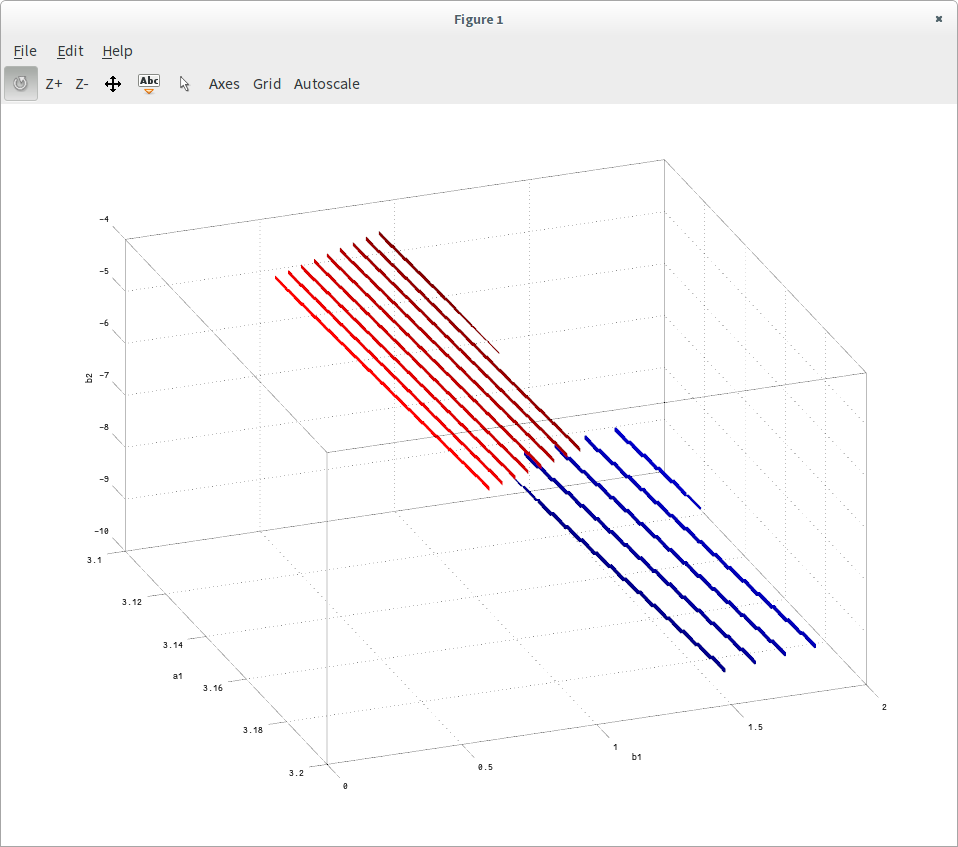
The 3D plotting of parameters a1 vs. b1 and b2 looks a little bit
strange, maybe my function contains an error, I didn't look so much into
detail.
![]() screenshot.png
screenshot.png
Description: PNG image
![]() parameter_estimation.m
parameter_estimation.m
Description: Text Data
![]() screenshot-3d.png
screenshot-3d.png
Description: PNG image
![]() signature.asc
signature.asc
Description: OpenPGP digital signature
| [Prev in Thread] | Current Thread | [Next in Thread] |