[Date Prev][Date Next][Thread Prev][Thread Next][Date Index][Thread Index]
Re: Problem with PostScript output of surface plot
|
From: |
Mike Miller |
|
Subject: |
Re: Problem with PostScript output of surface plot |
|
Date: |
Thu, 5 May 2016 12:01:00 -0700 |
|
User-agent: |
Mutt/1.6.0 (2016-04-01) |
On Wed, May 04, 2016 at 19:42:36 +0000, David M. Cook wrote:
> 4 May 2016
>
> Greetings,
>
> Executing the script
>
> graphics_toolkit( 'gnuplot' )
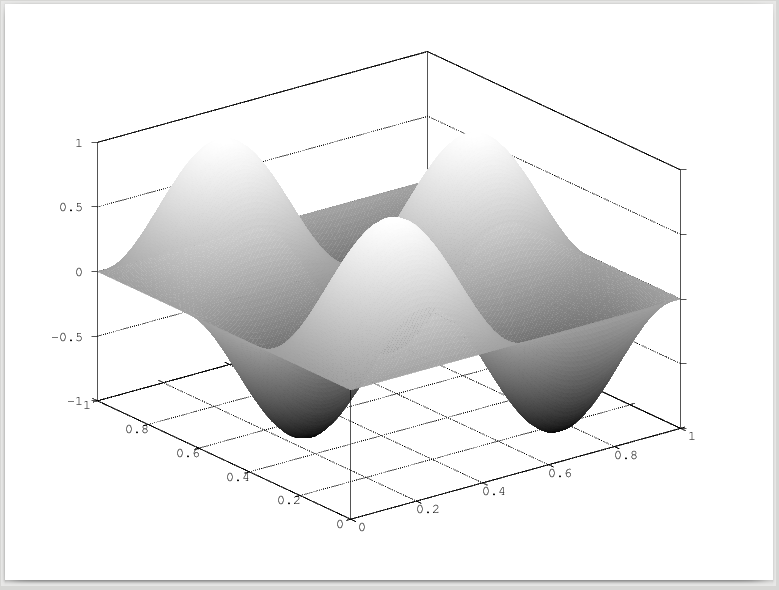
> [x,y] = meshgrid( [0.0:0.02:1.0], [0.0:0.02:1.0] );
> z = sin(2.0*pi*x) .* sin(3.0*pi*y);
> surf(x,y,z)
> colormap( 'gray' )
> shading( 'interp' )
>
> produces a very satisfactory surface plot of the 2-3 mode of a vibrating
> square membrane. (I am running on a Windows 7 computer with Version 4.0.0 of
> OCTAVE.)
>
> I have attached the PostScript file created by the statement
>
> print -deps2 trial.eps
>
> executed after the above code has been executed. This display is not quite
> an accurate transcription of the on-screen display produced by OCTAVE.
>
> Have I discovered a bug, a feature, or an oversight on my part of some
> additional command I should execute? The on-screen display is correct; the
> PostScript file is not.
>
> Thank you for your help.
I don't see any problems on my system or with the attached file.
People don't always see the same things, it would be helpful if you
would attach a screenshot of what you see in the figure that looks
correct, and also a screenshot of what you see when you open the eps
file on your system.
I'm attaching a screenshot of what the eps file you attached looks like
when I view it.
--
mike
 ok.png
Description: PNG image