On May 16, 2016, at 9:59 AM, Sebastian <address@hidden> wrote:
Sorry now with bottom post...I have some serious problems with HomeBrew’s Octave 4.0.2, primarily with any kind of plotting. I’ve gone back to Octave 4.0.0_5, which works fine for me.
I don’t know what to report about 4.0.2 or where. Here is a typical problem:
~$ octave --no-gui
GNU Octave, version 4.0.2
…
octave> x = 0 : 0.1 : 4;
octave> setenv GNUTERM qt;
octave> plot(x, sin(x));
octave> 2016-05-15 17:03:39.865 octave-gui[11088:451929] modalSession has been exited prematurely - check for a reentrant call to endModalSession:
warning: print.m: fig2dev binary is not available.
Some output formats are not available.
warning: called from
__print_parse_opts__ at line 385 column 9
print at line 288 column 8
error: print: printing not available without gl2ps library
error: called from
__opengl_print__ at line 168 column 7
print at line 431 column 14
error: octave_base_value::convert_to_str_internal (): wrong type argument '<unknown type>’
...I am aware of plotting problems and I am currently trying to debug it.
Does the problem already occurs while plotting or when printing?
Possible solutions:
(a) try the following (it makes sure that gnuplot is used)
octave-cli --no-window-systemgraphics_toolkit gnuplot;
setenv GNUTERM qt;
x = 0:0.1:4; plot(x, sin(x));
Now with octave 4.0.2
~$ octave-cli --no-window-system
GNU Octave, version 4.0.2
...
octave> graphics_toolkit gnuplot;
octave> setenv GNUTERM qt;
octave> x = 0:0.1:4; plot(x, sin(x));
produces just what I've been getting with octave 4.0.0
And now, on a more substantial note
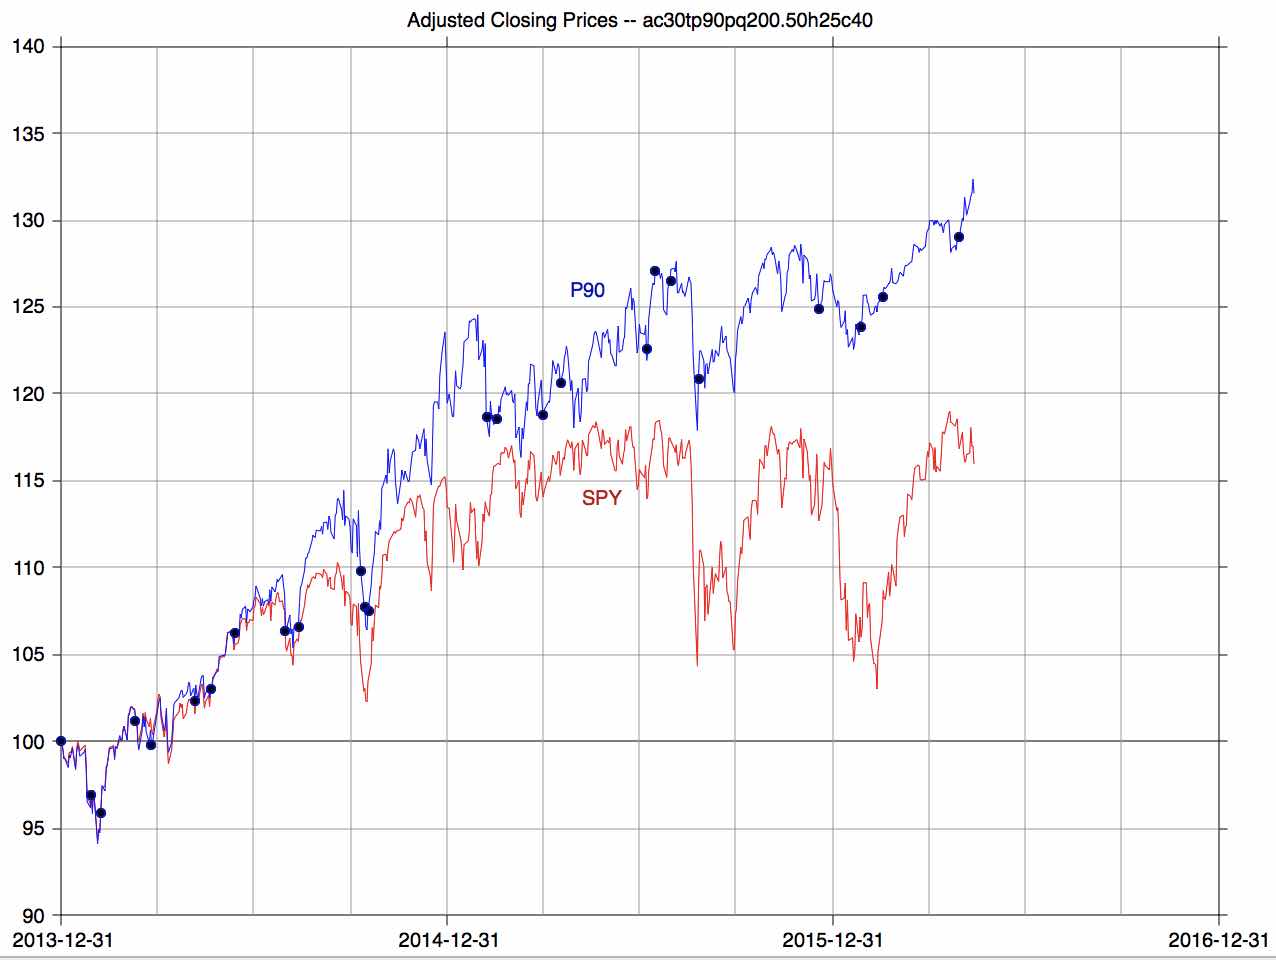
octave> SPDRBND_plotACP90
produces the following graph of the performance of a dynamic ETF
investment portfolio against the S&P 500 exchange traded fund SPY
from the end of 2013 through last Friday, 2016-05-13.
~$ octave-cli --no-window-system
GNU Octave, version 4.0.2
...
octave> graphics_toolkit gnuplot;
octave> setenv GNUTERM qt;
octave> x = 0:0.1:4; plot(x, sin(x));
produces just what I've been getting with octave 4.0.0
And now, on a more substantial note
octave> SPDRBND_plotACP90
produces the following graph of the performance of a dynamic ETF
investment portfolio against the S&P 500 exchange traded fund SPY
from the end of 2013 through last Friday, 2016-05-13.
Regards,
Vic