Description: PNG image
|
| From: | Nicholas Jankowski |
| Subject: | Re: test this in matlab for my please |
| Date: | Thu, 30 Jun 2016 15:18:49 -0400 |
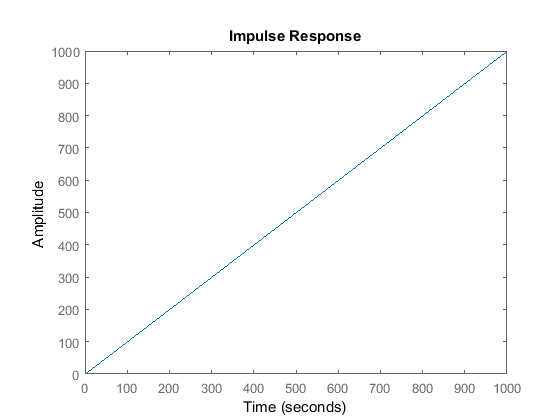
![]() Figure1.png
Figure1.png
Description: PNG image
![]() Figure2.png
Figure2.png
Description: PNG image
| [Prev in Thread] | Current Thread | [Next in Thread] |