using either qt, fltk, gnuplot, the script
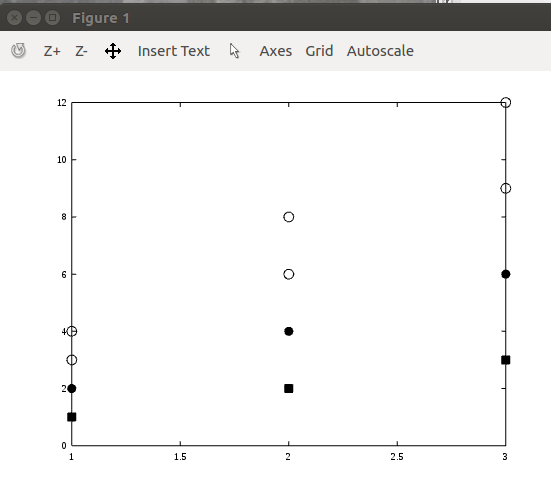
for m=1:3
sig=m*[1:3];
plot(m,sig(1),'ks','markersize',8,'markerfacecolor','k');hold on;
plot(m,sig(2),'k.','markersize',14);
plot(m*ones(size(sig(3:end))),sig(3:end),'ko','markersize',10);
endfor
produce the correct screenplot, see attached for the qt version
Attempts tp print the plot on eps using e.g.
>> graphics_toolkit qt
>> close all
>> debugprint;% (the script above)
>> print -deps temp.eps
>> quit
fail on all three toolkits,
for qt and fltk the eps file is appended. A screen mask appears to have been overlayed over symbols plotted using the 2nd and 3rd call to plot. The points that are shown correctly in the eps file are from the first call to plot.
for gnuplot, al the points appear, but are in color, even though the print statement specifies -deps rather than -depsc