Description: PNG image
|
| From: | oss |
| Subject: | Re: Missing data points when plotting with Qt |
| Date: | Tue, 15 Aug 2017 17:04:28 +0200 (CEST) |
| User-agent: | ALL-INKL Webmail 2.11 |
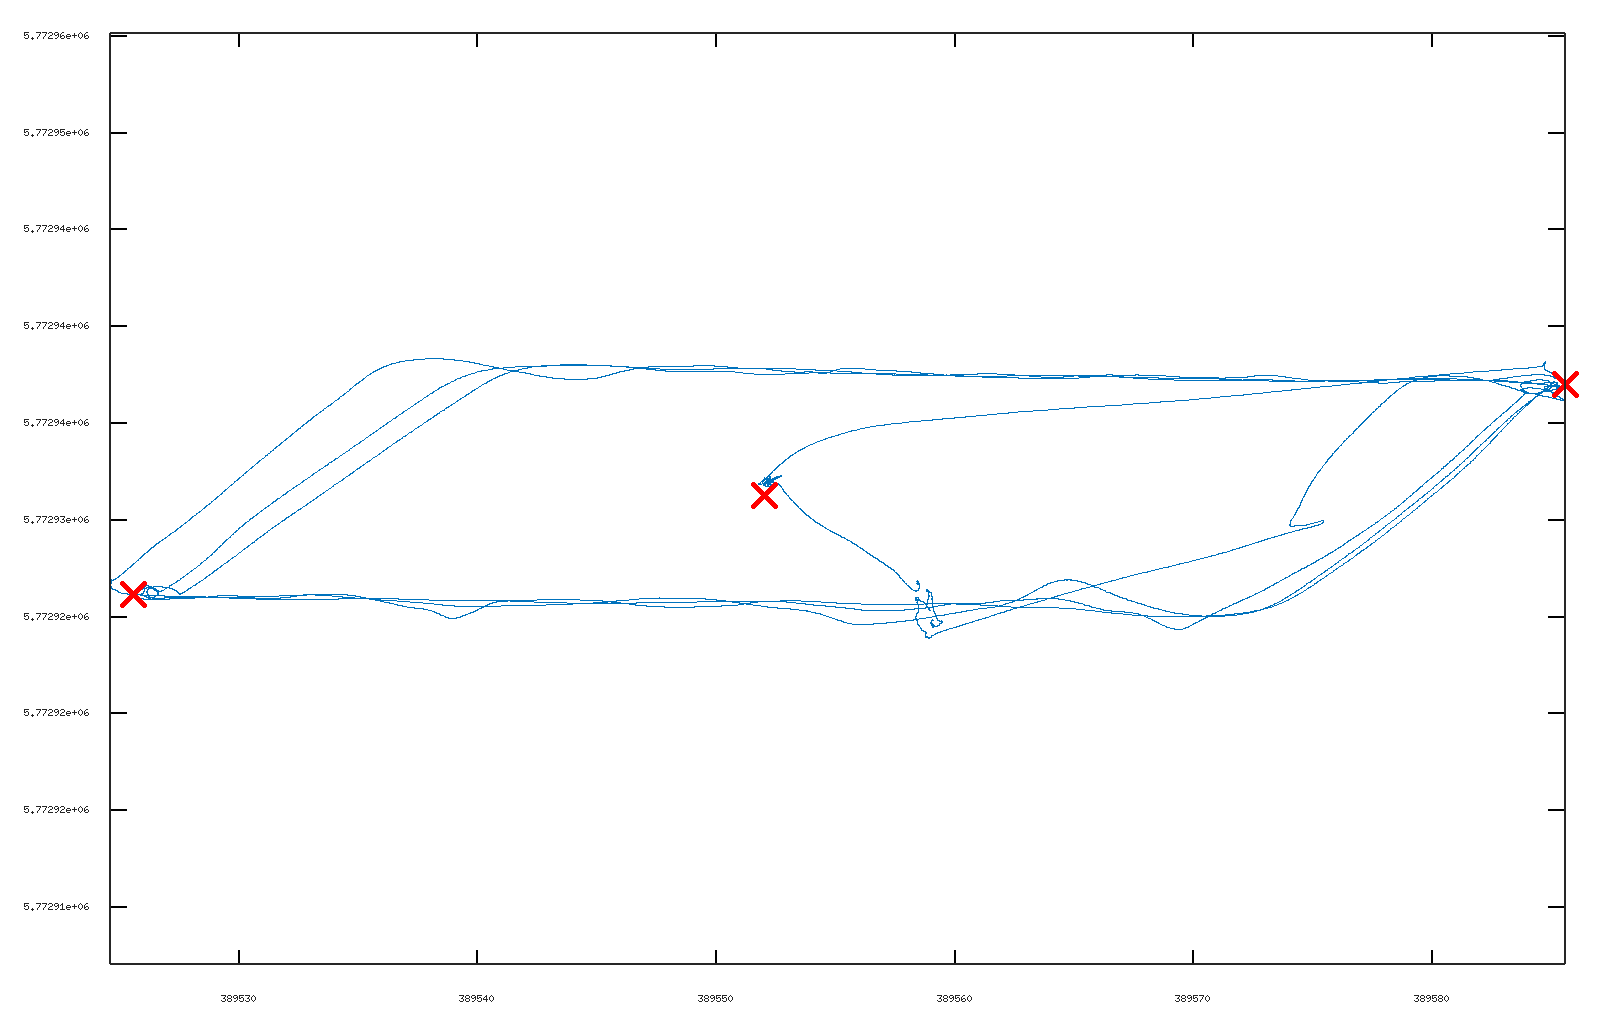
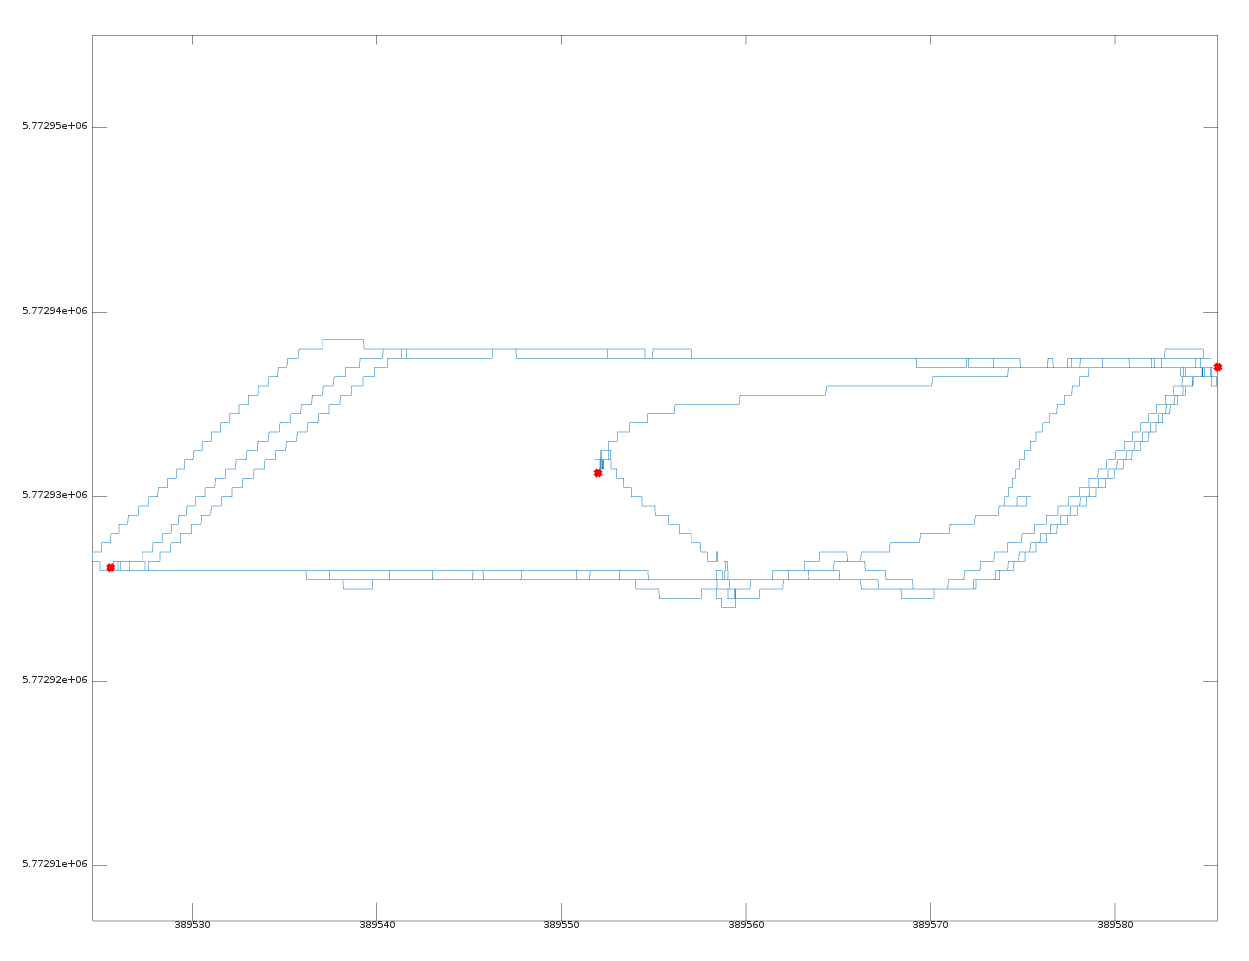
Please find attached screenshots of the same data plotted with both Qt and gnuplot. I executed exactly the same script that just loads the data (a recorded GPS trajectory) and plots it.
Dmitri A. Sergatskov wrote on 15.08.2017 16:43:
On Tue, Aug 15, 2017 at 9:31 AM, <address@hidden> wrote:Hi everyone,
I just plotted about 50'000 data points using the Qt graphics toolkit and recognised that many data points are left out. I think the plot backend reduces the number of points due to performance reasons. However, if I change the graphics toolkit to gnuplot the result looks more like what I expect, i.e. much more points are plotted. On the other hand, if I do plot(x, y, '.') the result generated by Qt also looks fine. Is there a way to adjust the number of plotted points for the Qt toolkit when I do plot(x,y)?
Octave version is 4.2.1.
Since you did not provide an example that demonstrate this problem, we do not believe youjust assume you are making it up.The Qt backend does not any such things. What you probably see is an effect of the displayantialiasing.Dmitri.--
![]() plot_gnuplot.png
plot_gnuplot.png
Description: PNG image
![]() plot_qt.png
plot_qt.png
Description: PNG image
| [Prev in Thread] | Current Thread | [Next in Thread] |