Octave 4.0.0
code:
code:
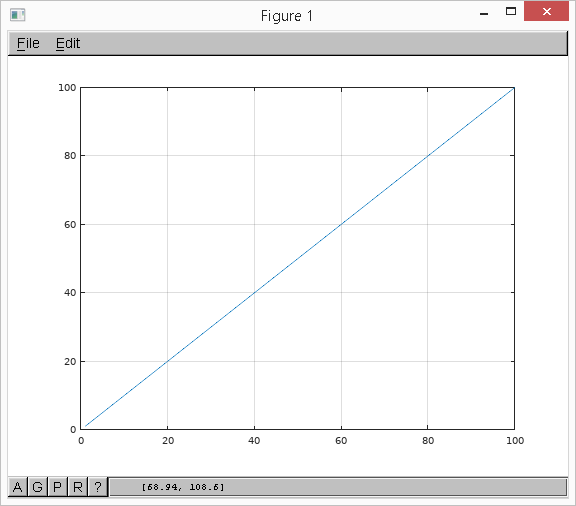
figure
plot( 1:100 )
grid on
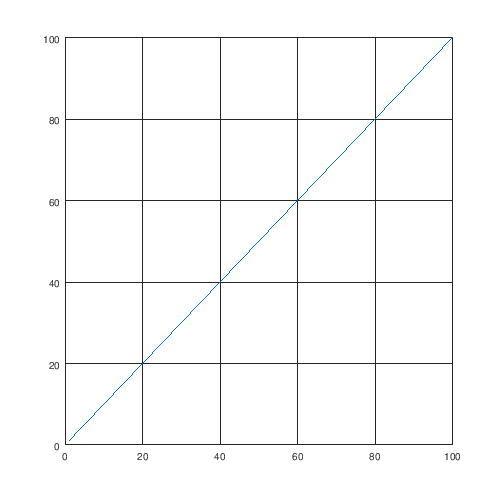
print( 'test.png', '-dpng ','-S500,500', '-color' )
In https://engineeringliberty.wordpress.com/2011/10/07/making-great-plots-in-octave-and-matlab-too/
In https://engineeringliberty.wordpress.com/2011/10/07/making-great-plots-in-octave-and-matlab-too/
I can see that the second graph down has an example of nice grey (as per the window)
The figure looks like this in Octave
It prints to test.png like this
I have been through all the gca settings I can see, relevant. There's a LOT.
The printed plot respects none of them
If anyone could help diagnose this it would be appreciated
The printed plot respects none of them
If anyone could help diagnose this it would be appreciated
Tim