ubuntu 16.04, octave 4.2.1
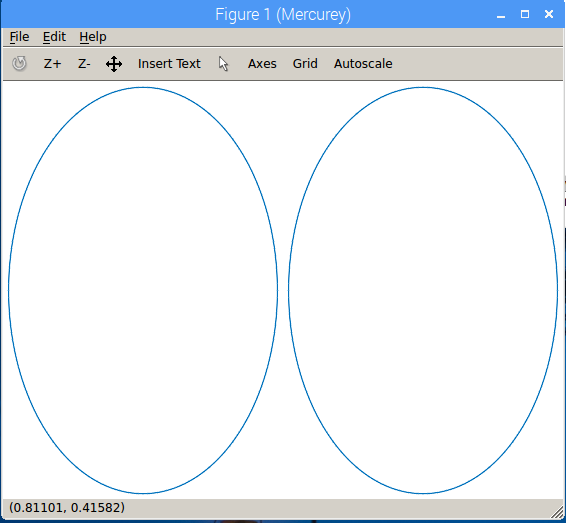
This script produces a screen image with two circles side-by side:
clear;
t=linspace(0,2*pi,181);x=cos(t);y=sin(t);
axes("position",[0.01,0.015,0.48,0.97]);
plot(x,y,'linewidth',2)
axis off;box off;
axes("position",[0.51,0.015,0.48,0.97]);
plot(x,y,'linewidth',2)
axis off;box off
print -dpdf TestPrint2.pdf
A screenshot is attached showing the image as expected. The print command produces a pdf file (also attached) that only shows the left hand circle??
Thanks so much!