Description: PNG image
|
| From: | Dietmar Warning |
| Subject: | different results in fft of an chirp in matlab and octave |
| Date: | Wed, 7 Mar 2018 14:47:54 +0100 (CET) |
Dear octave user,
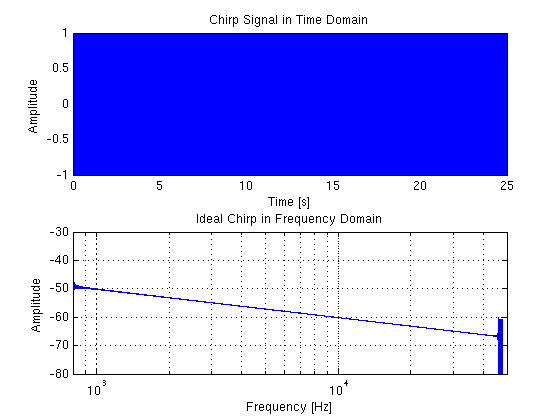
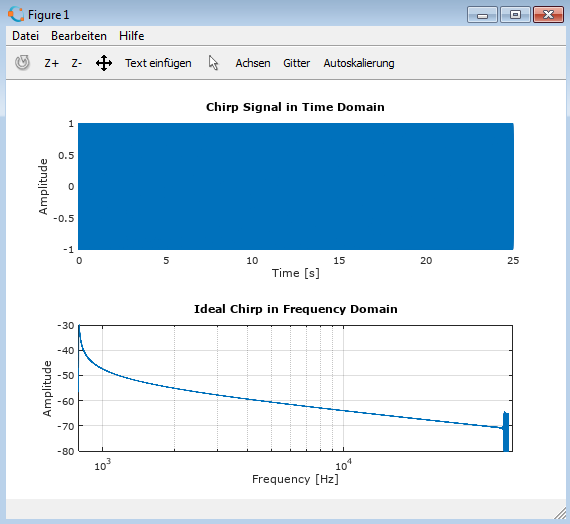
can anybody help me to find out why I get different results by plotting the fft results of a 800 ... 50kHz chirp Signal in matlab and octave.
Please see the attached screenshots and the used script. It looks for me that the behaviour in low frequency end is more reasonable in matlab.
Any hint is appreciated
Dietmar
![]() matlab_chirp_fft.png
matlab_chirp_fft.png
Description: PNG image
![]() octave_chirp_fft.png
octave_chirp_fft.png
Description: PNG image
![]() test_chirp_fft.m
test_chirp_fft.m
Description: Binary data
| [Prev in Thread] | Current Thread | [Next in Thread] |