Description: PNG image
|
| From: | Przemek Klosowski |
| Subject: | Re: different results in fft of an chirp in matlab and octave |
| Date: | Wed, 7 Mar 2018 17:38:18 -0500 |
| User-agent: | Mozilla/5.0 (X11; Linux x86_64; rv:52.0) Gecko/20100101 Thunderbird/52.6.0 |
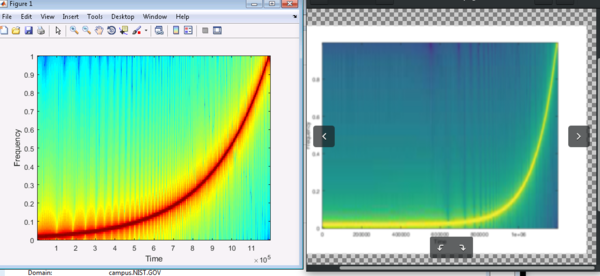
On 03/07/2018 04:33 PM, Mike Miller wrote:
If you look at plots of specgram(ChirpSignal) in Octave and Matlab, Octave's looks like it spends too much time in the low frequency range.On Wed, Mar 07, 2018 at 14:47:54 +0100, Dietmar Warning wrote:can anybody help me to find out why I get different results by plotting the fft results of a 800 ... 50kHz chirp Signal in matlab and octave.Yes, this is likely an error in the Octave chirp function with the "logarithmic" option.
![]() f.png
f.png
Description: PNG image
| [Prev in Thread] | Current Thread | [Next in Thread] |