I am trying to make a figure that uses a somewhat thicker line for the frame / axes than the lines used for the grid. I tried plotting a rectangle with thick lines to mimic the figure frame. This almost works perfectly, but the lower right corner does not come out well. The lines don't meet nicely (see attachment).
Here's an example to illustrate the problem:
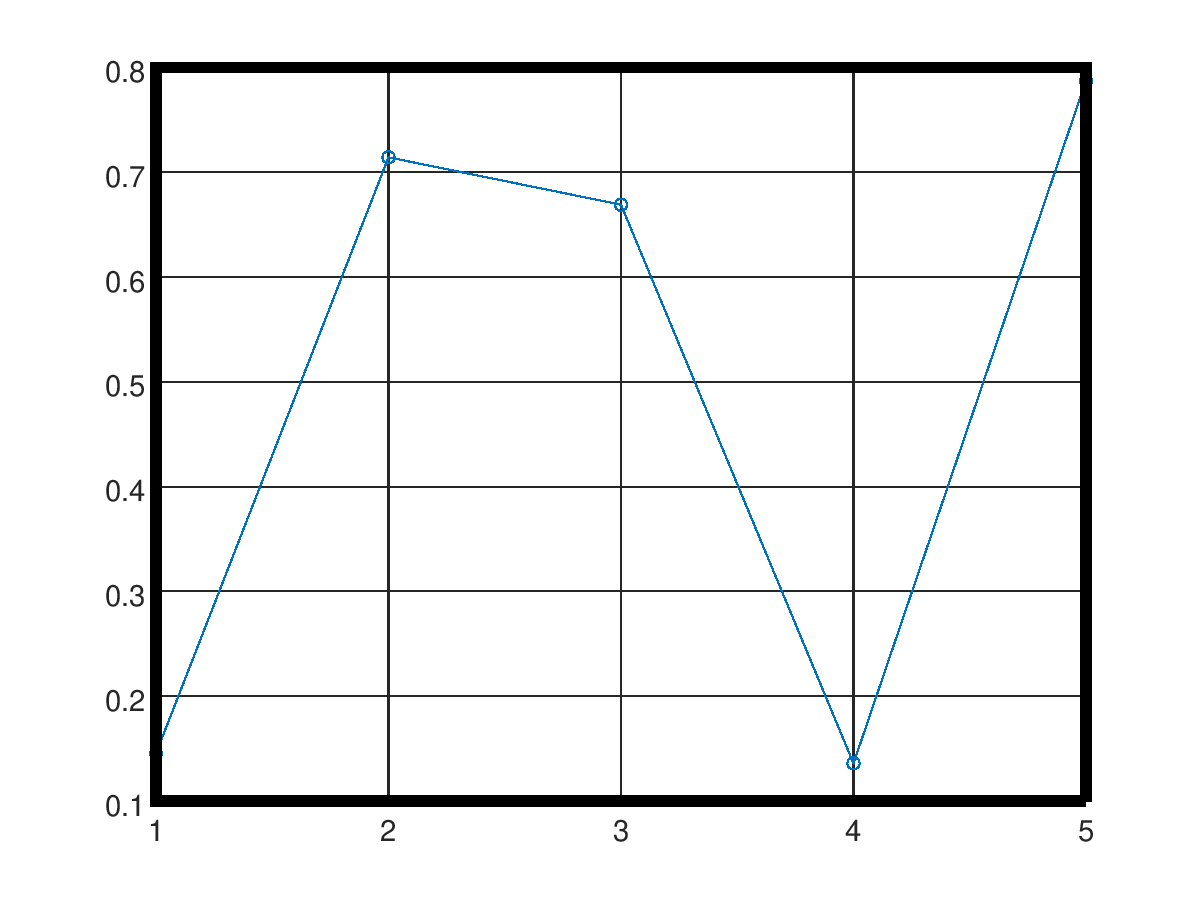
plot (rand(1,5),'-o' , 'Linewidth',2); % plot some data
grid on % show grid lines (thin)
r = axis(); % find the coordinates of the figure frame
rectangle ( 'Position',[r(1) r(3) r(2)-r(1) r(4)-r(3)] , 'Linewidth',5 ) % plot the figure frame using thick lines
print ('test.png') % save
to file
Any ideas how to make this work?