Description: GIF image
|
| From: | James Watts (Contractor) |
| Subject: | How to change the scale on a contour plot colorbar |
| Date: | Tue, 18 Feb 2020 15:36:51 +0100 (CET) |
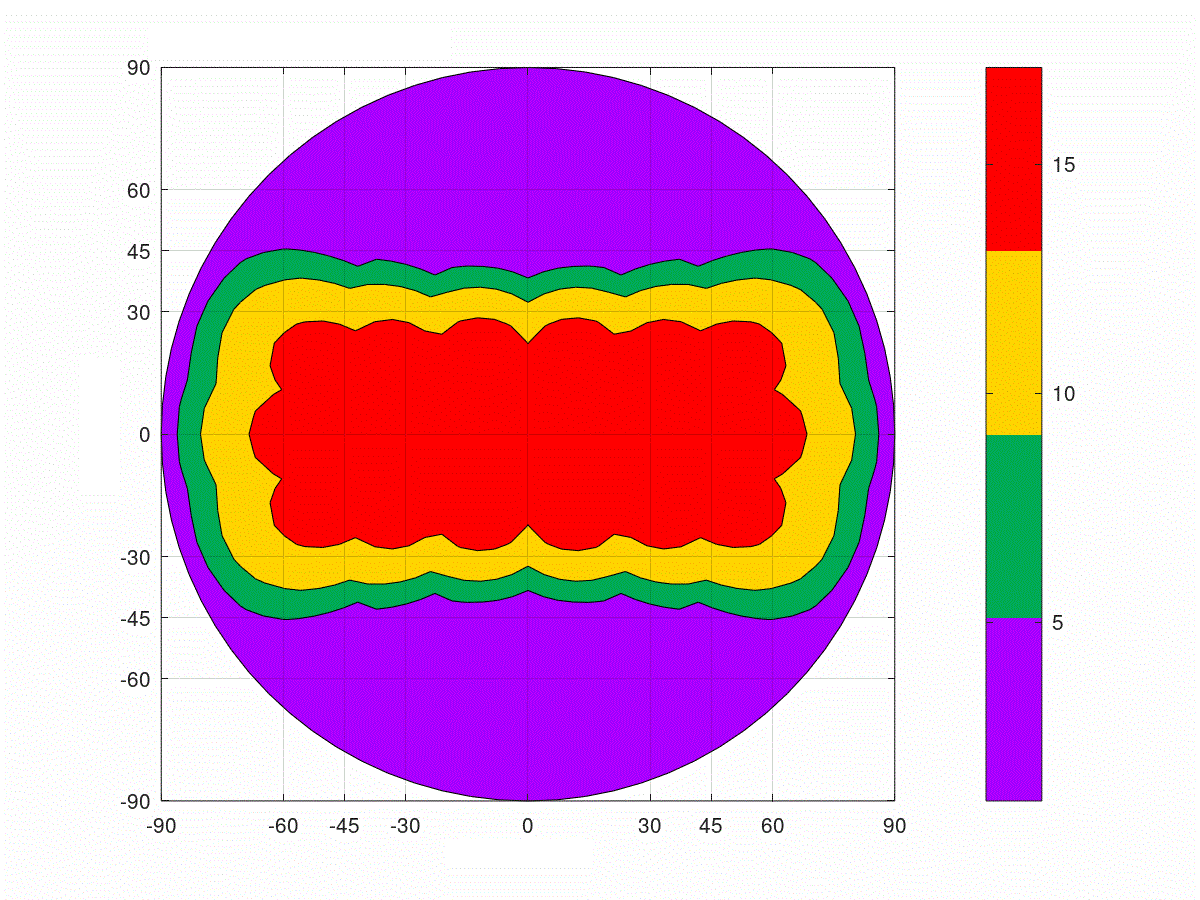
Can anyone tell me how to change the numeric scale on the colorbar legend on a contour plot? I have tried various combinations of caxis and zaxis, cticks, zticks, cticklabels, zticklabels and I either see nothing change or I get an error. I can’t find a description of this in the Octave or Matlab documentation. (On the attached image, I’m trying to get the numeric scale to match the color scale). Thanks,
-- IMPORTANT NOTICE: The contents of this email and any attachments are confidential and may also be privileged. If you are not the intended recipient, please notify the sender immediately and do not disclose the contents to any other person, use it for any purpose, or store or copy the information in any medium. Thank you. |
![]() contour.gif
contour.gif
Description: GIF image
| [Prev in Thread] | Current Thread | [Next in Thread] |