Description: PNG image
|
| From: | Dmitri A. Sergatskov |
| Subject: | Re: Plot command crashes Octave |
| Date: | Mon, 4 Jul 2016 13:35:53 -0500 |
Hi
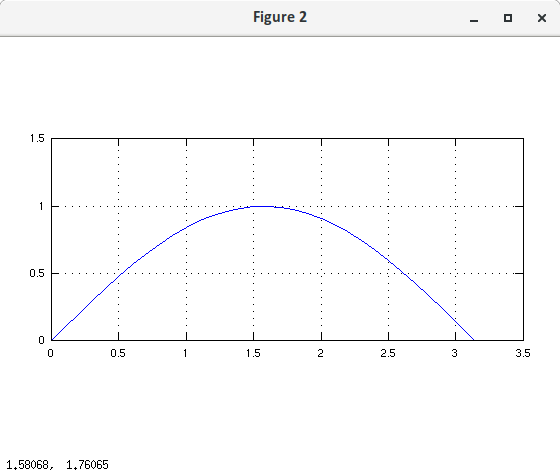
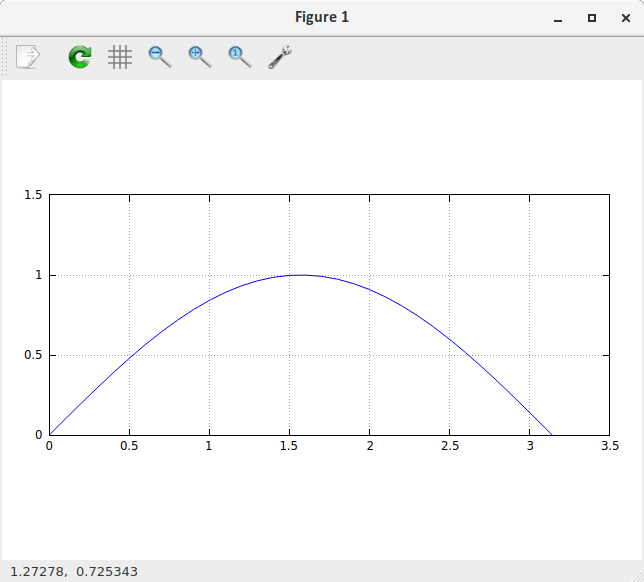
A slight modification of your script does not work on my El Capitan Octave
(homebrew version 4.0.2). The problem: octave/gnuplot can only draw
dotted grid lines, which are almost impossible to see with the default
0.5 linewidth. Here is a demonstration script.
% test_octave_graphics.m - to demonstrate an octave/gnuplot problem
graphics_toolkit('gnuplot');
x = 0 : 0.1 : 3.5;
y = sin(x);
close all;
figure;
plot(x, y);
axis([0, 3.5, 0, 1.5], "equal");
set(gca, "xgrid", "on", "ygrid", "on", ...
"gridlinestyle", "-", ...
"xtick", [0 : 0.5 : 3.5], ...
"ytick", [0 : 0.5 : 1.5] ...
);
Change the first line to
graphics_toolkit(‘qt’);
and you will see solid grid lines —- as you should.
Regards,
Vic
![]() Screenshot_from_2016-07-04_13-32-18.png
Screenshot_from_2016-07-04_13-32-18.png
Description: PNG image
![]() Screenshot_from_2016-07-04_13-28-15.png
Screenshot_from_2016-07-04_13-28-15.png
Description: PNG image
| [Prev in Thread] | Current Thread | [Next in Thread] |