On Sun, Aug 7, 2016 at 11:25 AM, Martin Marmsoler <address@hidden> wrote:
There should be a own figure for every power level with graphs for some different voltage levels.Hello Doug,but in this case, everytime the power_rel value will calculated for a new voltage at same power, these values will overwrite my plot.Here you can see the structure I would have:figure1 (power level 1):- voltage 1 data- voltage 2 data
- ...figure2 (power level 2):- voltage 1 data- voltage 2 data
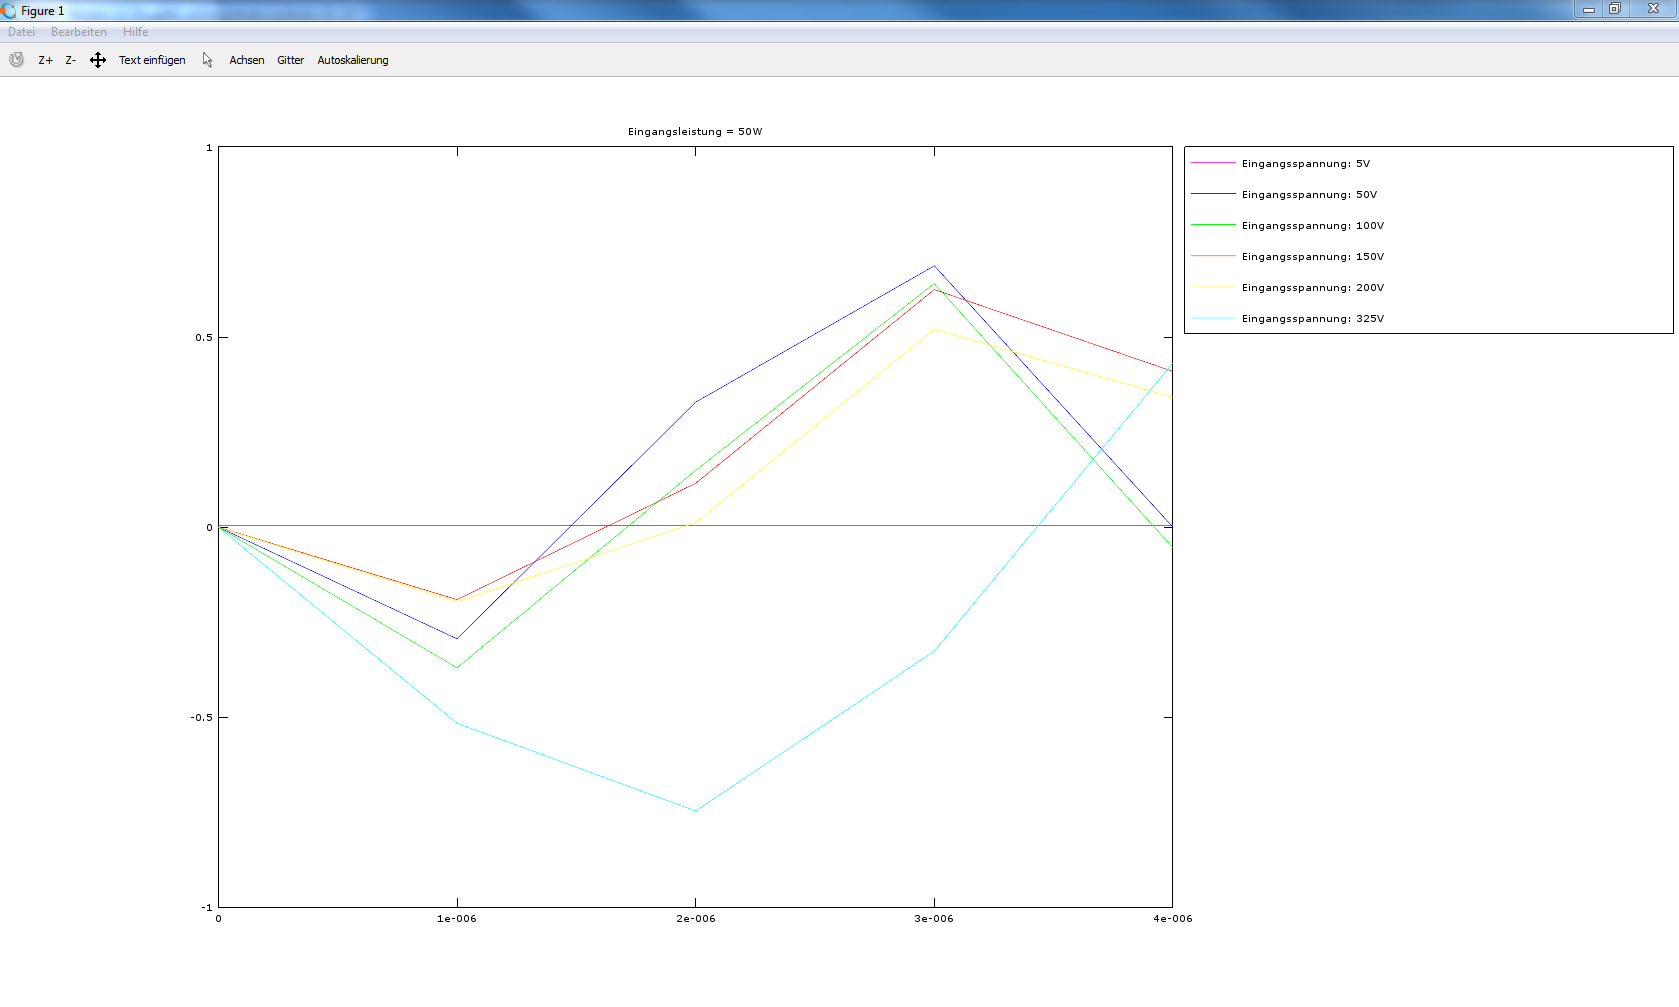
- ...Here a screenshot of the actual plot:I tried to but the x and ylabel after I plotted the data, and it works fine. Is that a bug or why I have to do that?Best regards
OK so you have something now that works?
I will try and make a more simple example to see if it is a bug.
Martin2016-08-07 17:05 GMT+02:00 Doug Stewart <address@hidden>:I think i see some things that might help.On Sun, Aug 7, 2016 at 10:18 AM, Martin Marmsoler <address@hidden> wrote:Sorry, I forgot to upload the script.2016-08-07 16:14 GMT+02:00 Doug Stewart <address@hidden>:On Sun, Aug 7, 2016 at 5:11 AM, Martin Marmsoler <address@hidden> wrote:Hello,I tried to plot some data from files in Octave. It works fine when I commented out the x & y labels. But when I turn them on, sometimes the plot stays white and sometimes there is something but completly wrong. Attached you can find the script: https://www.dropbox.com/sh/m5ujeyn35pgog8x/AACV5MaTdyKtxg29b 3JqWUzja?dl=0 Dropbox says that that folder is empty !!MartinHope someone can help me with it.Best regards
_______________________________________________
Help-octave mailing list
address@hidden
https://lists.gnu.org/mailman/listinfo/help-octave
--
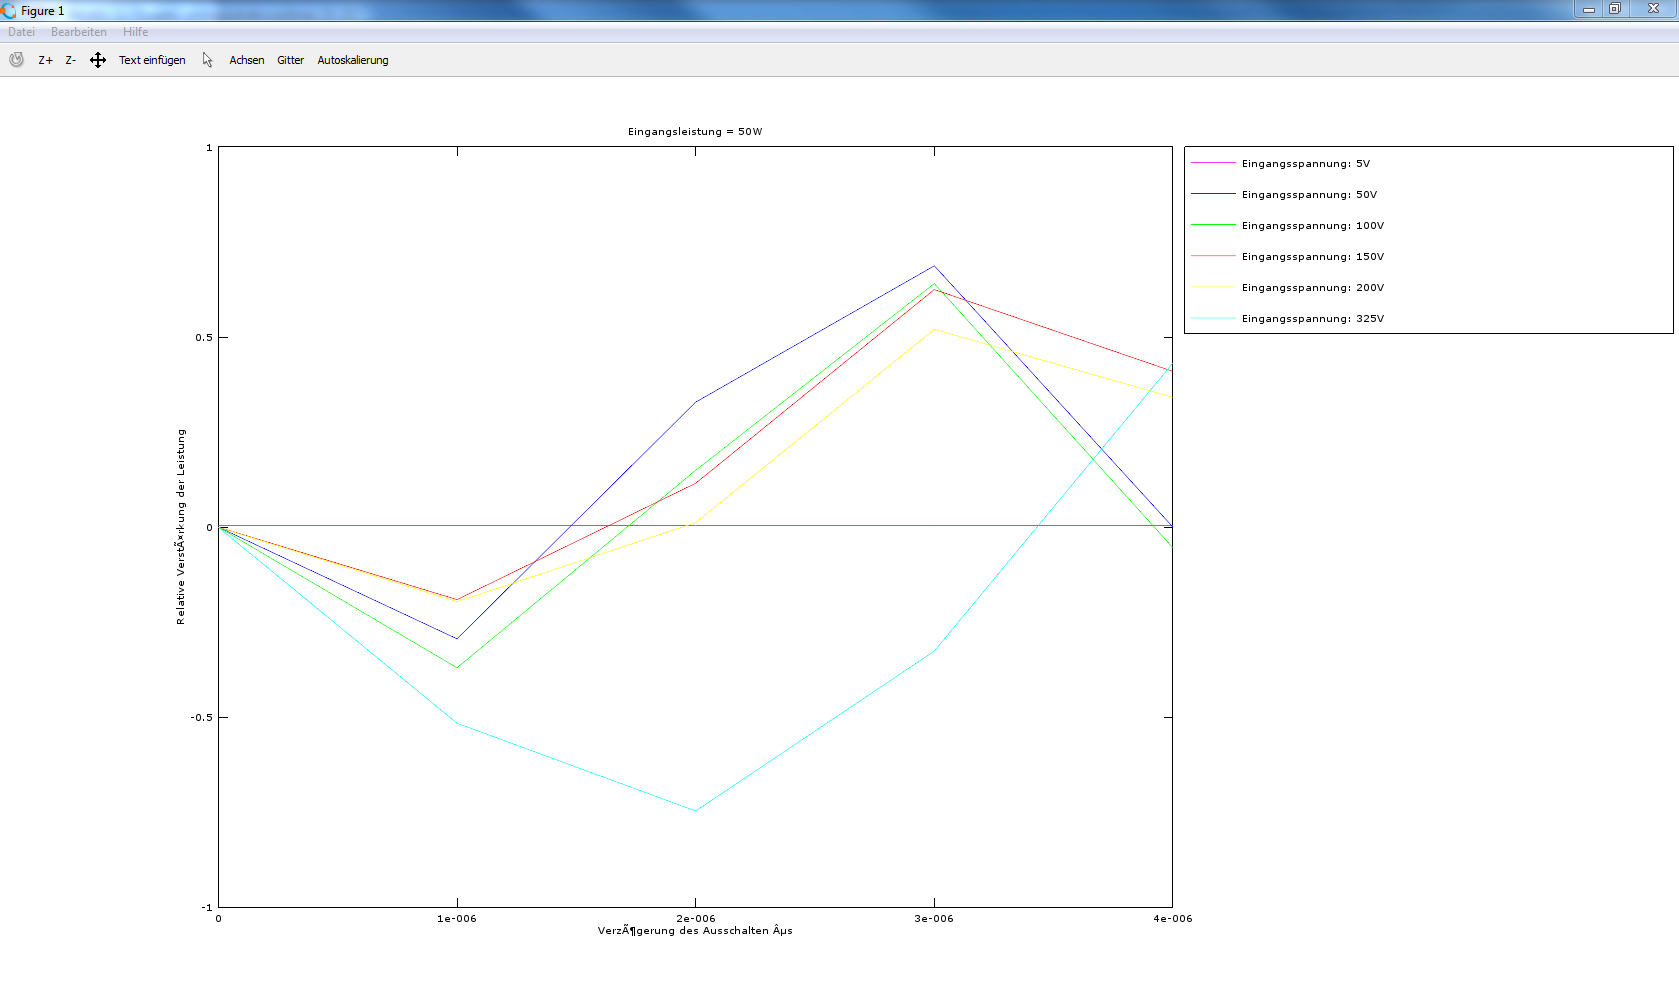
I think you should get rid of the hold on and off.try this# hold on;plot(delay_val, power_data(:,1),'color',rand(1,3),delay_val, power_data(:,2),'color',rand(1 ,3),delay_val, power_data(:,3),'color',rand(1 ,3)); # hold off;lgd2{voltage_counter} = ['Eingangsspannung: ' num2str(voltage_val(voltage_counter)) 'V']; %legend(lgd2,'location','northeastoutside'); %print("plot.pdf");xlabel("Verzoegerung des Ausschalten us");ylabel("hi")you can see that i also moved the xlabel and ylabel down to here at theend of the plotLet me know if this helps--