[Date Prev][Date Next][Thread Prev][Thread Next][Date Index][Thread Index]
Re: Trying to Plot grid lines every 7 days
|
From: |
Nicholas Jankowski |
|
Subject: |
Re: Trying to Plot grid lines every 7 days |
|
Date: |
Wed, 9 Aug 2017 10:12:13 -0400 |
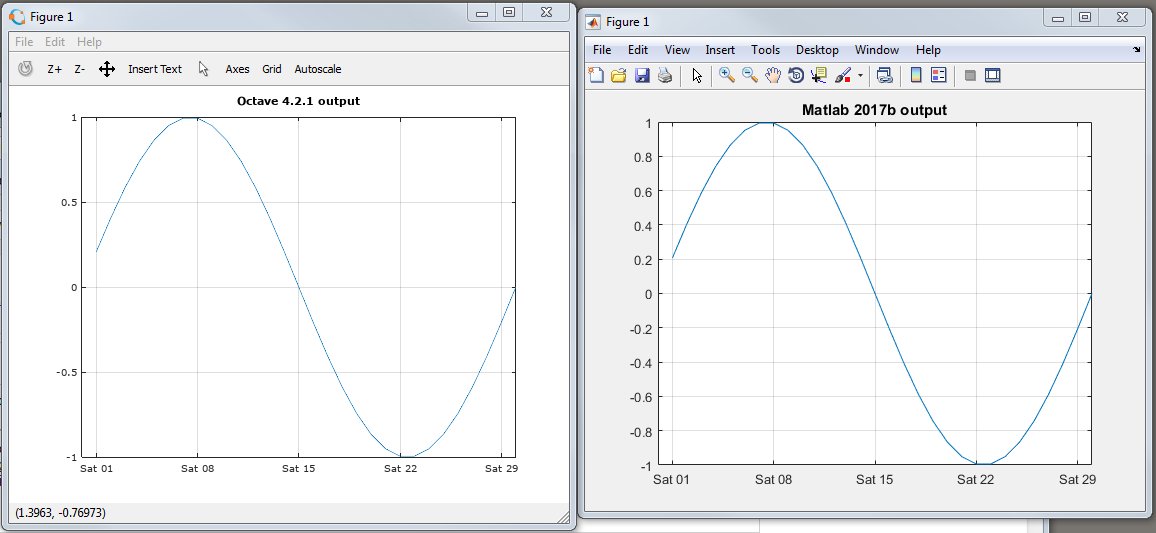
The following gives me the same results in Matlab and Octave.  Is
this, using 'keeplimits' and/or 'keepticks' what you're looking for?

plot( 1:30, sin((1:30) .* (2 * pi / 30) ) )
grid on
set (gca, 'xtick', 1:7:30)
datetick ('x', 'ddd dd', 'keepticks', 'keeplimits')

output images attached
 datetickplotcompare.png
Description: PNG image