[Date Prev][Date Next][Thread Prev][Thread Next][Date Index][Thread Index]
Re: Trying to Plot grid lines every 7 days
|
From: |
Nicholas Jankowski |
|
Subject: |
Re: Trying to Plot grid lines every 7 days |
|
Date: |
Wed, 9 Aug 2017 11:35:45 -0400 |
On Wed, Aug 9, 2017 at 11:05 AM, Tim Pierce <address@hidden> wrote:
> Yes, that must be it
>
> The datetick in octave does something quite unpredictable from the example I
> gave, where the sin wave wouldbe intact, but it wold stretch toonly the 20th
> day, instead of the 30th
Well, whether or not it's odd, matlab is also odd, and there does
appear to be some sort of output incompatibility.
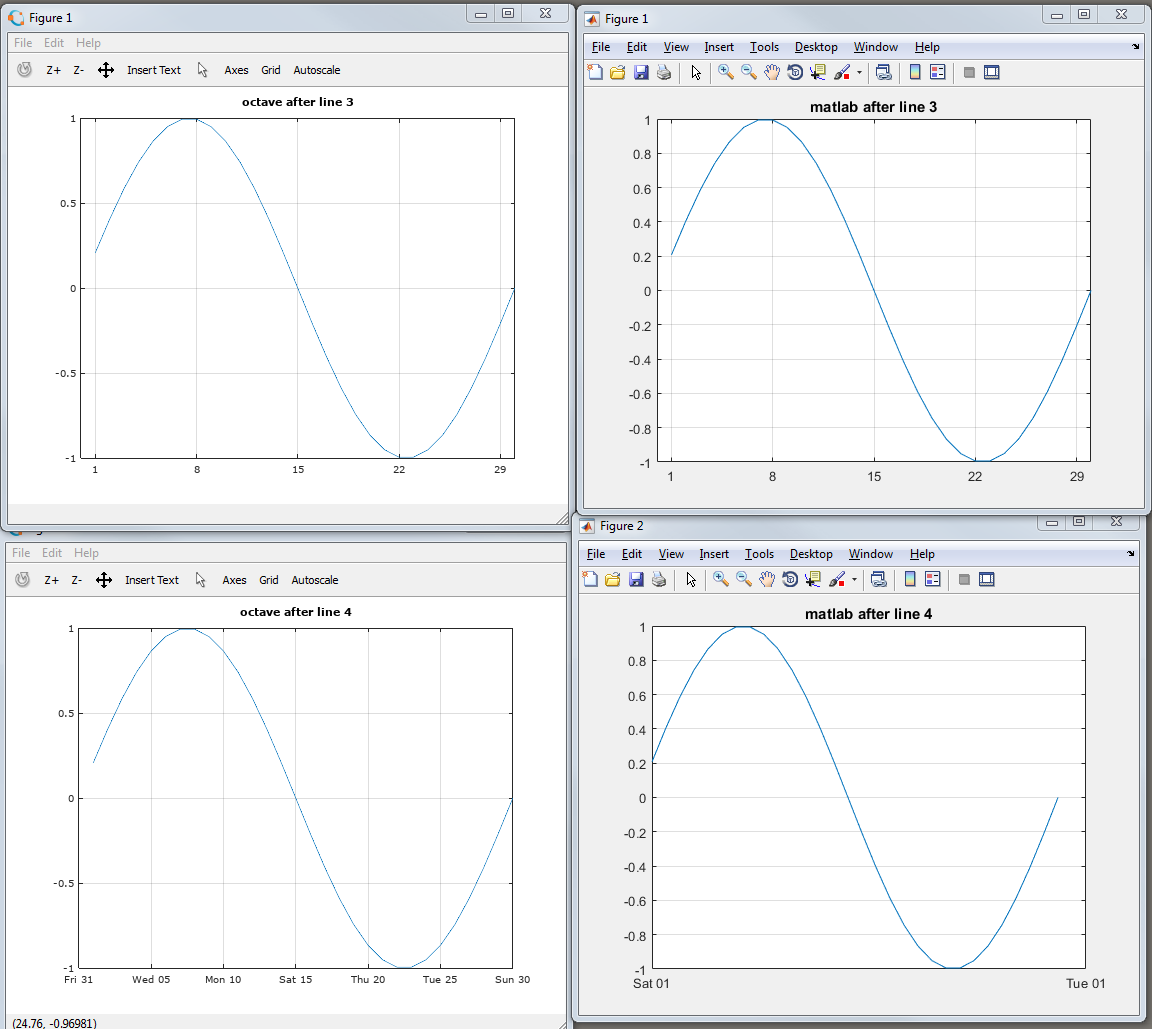
Running through your initial example without the 'keep' options, I've
attached the graphs as they look just before and after the final line:
1 plot( 1:30, sin((1:30) .* (2 * pi / 30) ) )
2 grid on
3 set (gca, 'xtick', 1:7:30)
4 datetick ('x', 'ddd dd')
(note, matlab doesn't let you leave out the 'x', but octave does.
doesn't change octave's output)
So matlab is also changing both the limits and tick locations of the
plot, but it's doing so differently than octave. It appears that
neither the inline help or website documentation provide any insight
into how datetick selects tick and limit values.
nickj
 datetickplotcompare2.png
Description: PNG image