Description: PNG image
|
| From: | Raag Saluja |
| Subject: | Re: saving the plot |
| Date: | Fri, 15 Nov 2019 12:03:21 +0530 |
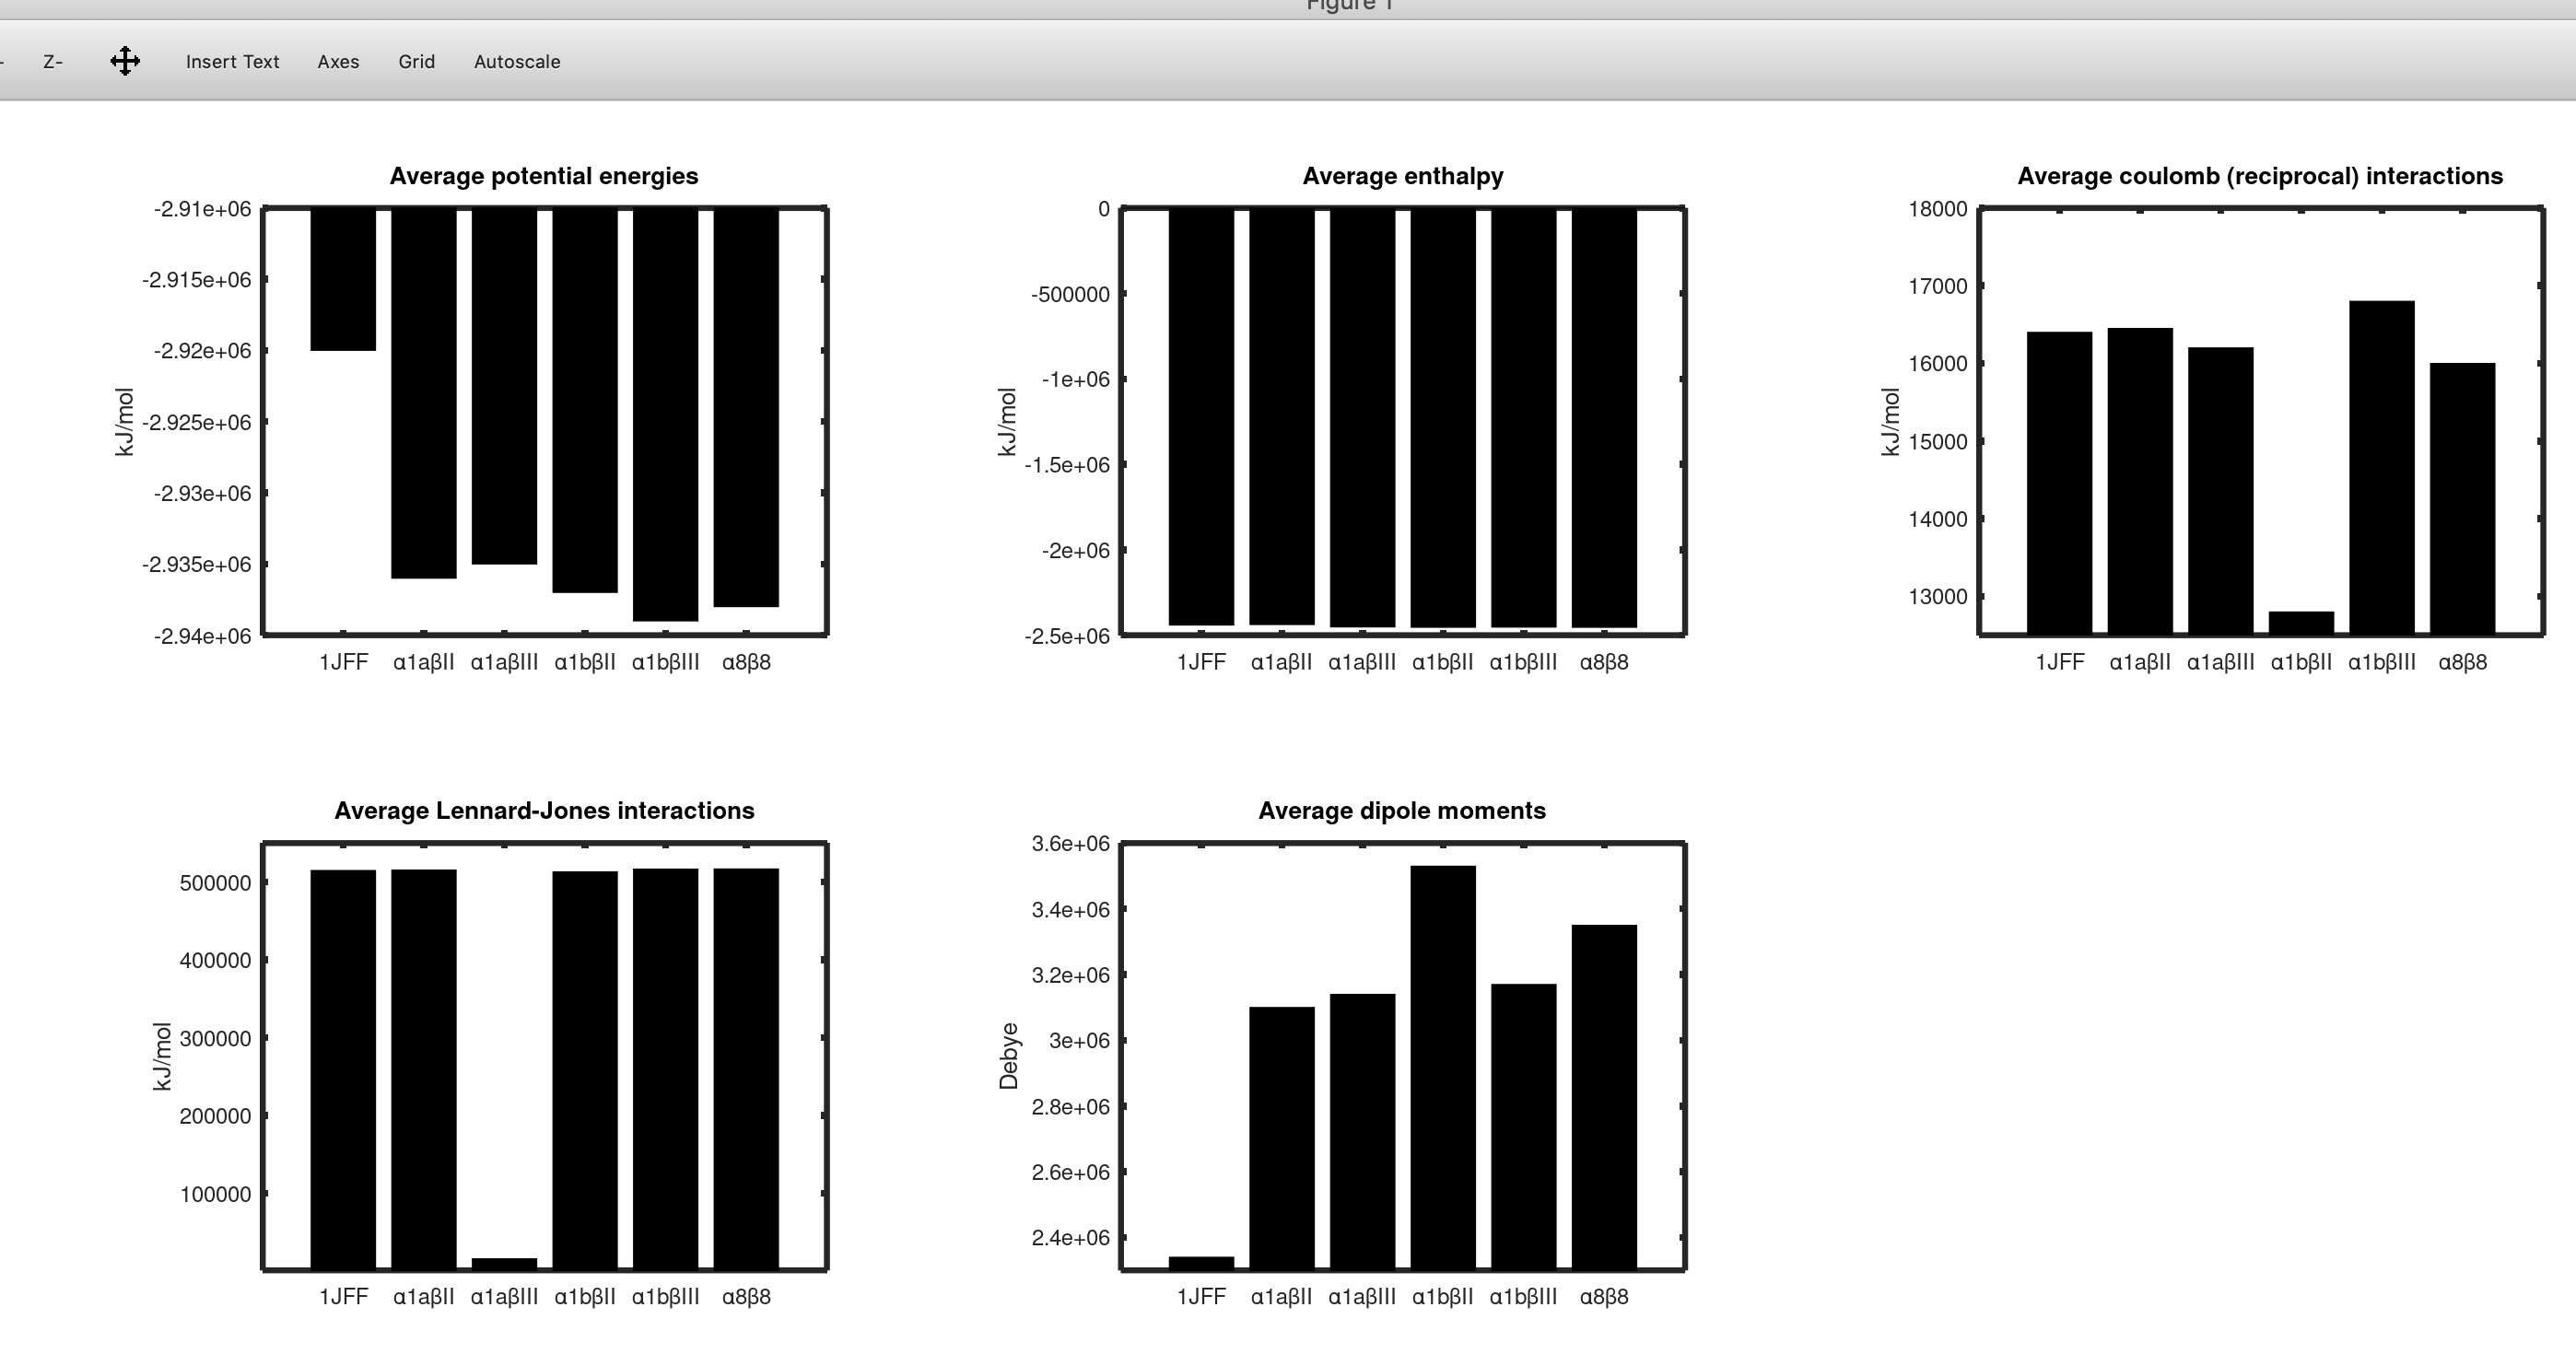
X = 1:6;
P = [-2920000 -2936000 -2935000 -2937000 -2939000 -2938000];
C = [16400 16450 16200 12800 16800 16000];
E= [-2441000 -2438000 -2452000 -2454000 -2453000 -2454200];
L = [514900 515500 15900 513200 516700 516900];
D= [2340000 3100000 3140000 3530000 3170000 3350000];
subplot(2,3,1)
bar(P, 'k',0.8)
set(gca, "linewidth", 4, "fontsize", 12)
set(gca,"xticklabel",{'1JFF','α1aβII', 'α1aβIII', 'α1bβII', 'α1bβIII', 'α8β8'},"XTick",1:numel(P));
ylabel('kJ/mol')
title ("Average potential energies");
ylim ([-2940000 -2910000])
subplot(2,3,2)
bar(E, 'k',0.8)
set(gca, "linewidth", 4, "fontsize", 12)
set(gca,"xticklabel",{'1JFF','α1aβII', 'α1aβIII', 'α1bβII', 'α1bβIII', 'α8β8'},"XTick",1:numel(P));
title ("Average enthalpy");
ylabel('kJ/mol')
subplot(2,3,3)
bar(C, 'k',0.8)
set(gca, "linewidth", 4, "fontsize", 12)
set(gca,"xticklabel",{'1JFF','α1aβII', 'α1aβIII', 'α1bβII', 'α1bβIII', 'α8β8'},"XTick",1:numel(P));
title ("Average coulomb (reciprocal) interactions");
ylim ([12500 18000])
ylabel('kJ/mol')
subplot(2,3,4)
bar(L,'k',0.8)
set(gca, "linewidth", 4, "fontsize", 12)
set(gca,"xticklabel",{'1JFF','α1aβII', 'α1aβIII', 'α1bβII', 'α1bβIII', 'α8β8'},"XTick",1:numel(P));
title ("Average Lennard-Jones interactions");
ylim ([1000 550000])
ylabel('kJ/mol')
subplot(2,3,5)
bar(D, 'k',0.8)
set(gca, "linewidth", 4, "fontsize", 12)
set(gca,"xticklabel",{'1JFF','α1aβII', 'α1aβIII', 'α1bβII', 'α1bβIII', 'α8β8'},"XTick",1:numel(P));
ylabel('Debye')
title ("Average dipole moments");
ylim ([2300000 3600000])
hold on
h=figure(1)
saveas (h, 'myplot.png')
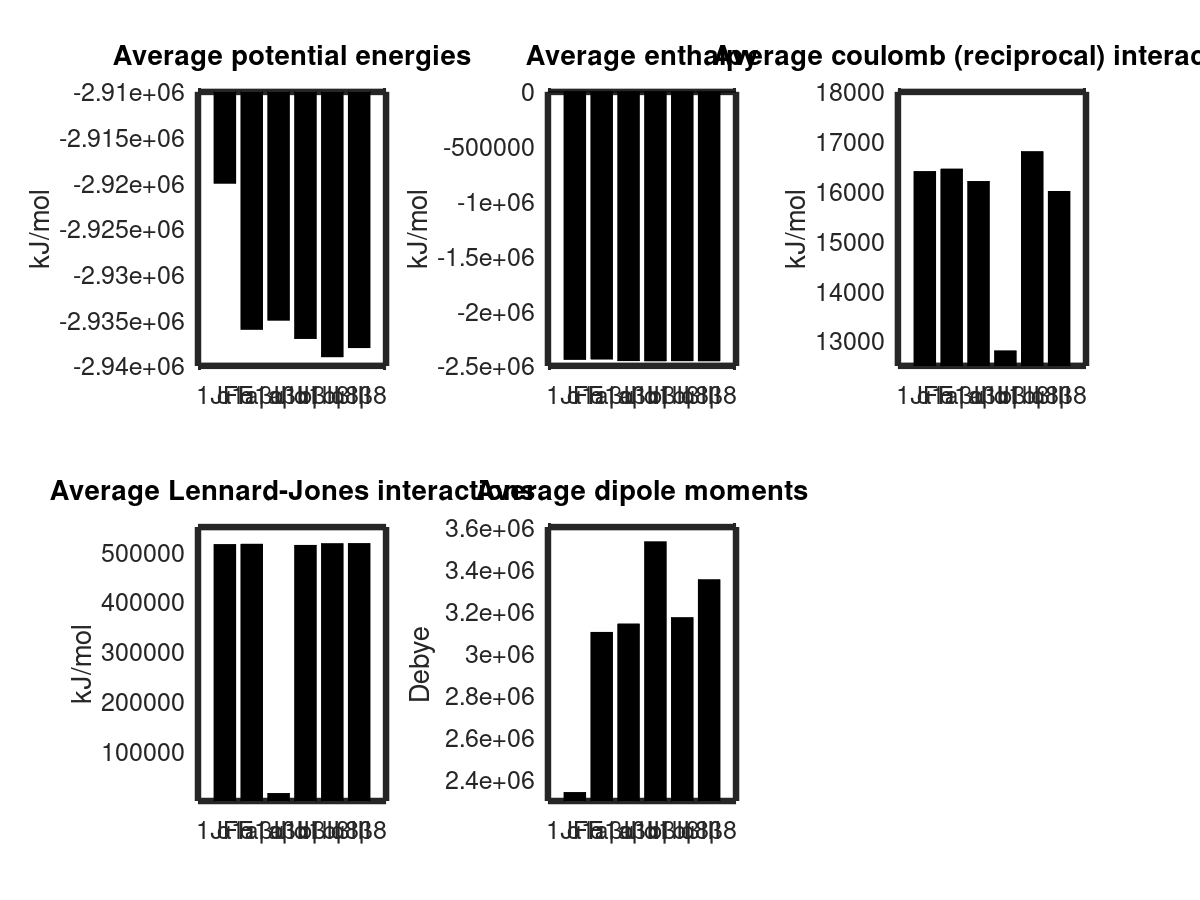
On Thu, Nov 14, 2019 at 12:50 AM Raag Saluja <address@hidden> wrote:Hi!When I view my subplots, I need to extend the screen in order to view the whole thing or the x axis labels get overlapped and you can't read anything. However, when I save my plot as an image, the screen size returns to the original size and all the labels are overlapped. How can I save the image such that the screen size doesn't return to the original dimensions? These are the commands I used:hold on
h=figure(1)
saveas (h, 'myplot.png')
Thank you and regards,
Raag Saluja,
Research scholar
Department of Zoology,
Faculty of Science
Dayalbagh Educational Institute
India
I've noticed inconsistency between GUI-displayed and saved text sizes as well, but unfortunately I do not know the solution. That said, the rest of us can't really help unless you send us an example to work with. Please send the code you used to generate the plot.My guess is that calling the figure command with the position property will solve the problem. From the documentation:
position: four-element vector, def.[300 200 560 420]Specify the position and size of the figure canvas. The four elements of the vector are the coordinates of the lower left corner and width and height of the figure. See units property.
For example, I begin figures I want to save with:
figure(1,"position",[350,100,1597,987])
The last two are the width and height, respectively. Try doing this first instead of manually resizing.
![]() actual screen of octave.png
actual screen of octave.png
Description: PNG image
![]() myplot.png
myplot.png
Description: PNG image
| [Prev in Thread] | Current Thread | [Next in Thread] |