Dear Tony,
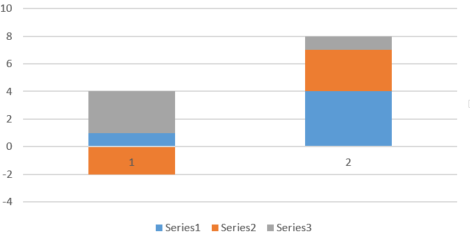
Thank you for your answer. For what I know, usually stacked bar would look like this (same data in excel):
The negative value block would be in the negative side and the positive value on the positive side, without overlap.
Kind regards,
Olivier
On Sun, 19 Apr 2020 at 17:26, Tony Richardson <address@hidden> wrote:
On Sun, Apr 19, 2020 at 9:05 AM Olive <address@hidden> wrote:Hello,
I am trying to plot a bar plot, stacked, containing positive and negative
value. Unfortunately, I don't manage to get a good result with the bar
function.
The stacked bar plot works well with positive values.
z=[1 2 3
4 3 1]
h = bar (z, 'stacked');
<https://octave.1599824.n4.nabble.com/file/t373739/bar_positive.gif>
And does not wok well with negative value. It seems the values are printed
on top of each other.
figure
z=[1 -2 3
4 3 1]
h = bar (z, 'stacked');
<https://octave.1599824.n4.nabble.com/file/t373739/bar_negative.gif>
Do you know a way to work around this?
Kind regards,
Olivier
--
Sent from: https://octave.1599824.n4.nabble.com/Octave-General-f1599825.html
The output is what I would expect to see (bar of height 1, overlaid with a bar of height -2, overlaid with a bar of height 3) so you only see the last bar. What are you expecting to see?Tony Richardson
Olivier Thomann
Senior Researcher
Innovation, Discovery and External Collaboration
Neste Corporation
Technology Centre, Kilpilahti
POB 310
06101 Porvoo, Finland
Mobile +358 (0)40 338 0371