On Mon, Apr 20, 2020 at 12:53 AM Olivier Thomann <address@hidden> wrote:
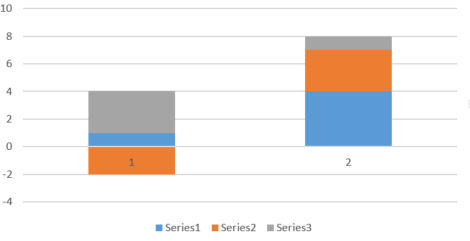
Dear Tony,Thank you for your answer. For what I know, usually stacked bar would look like this (same data in excel):The negative value block would be in the negative side and the positive value on the positive side, without overlap.Kind regards,OlivierOn Sun, 19 Apr 2020 at 17:26, Tony Richardson <address@hidden> wrote:On Sun, Apr 19, 2020 at 9:05 AM Olive <address@hidden> wrote:Hello,
I am trying to plot a bar plot, stacked, containing positive and negative
value. Unfortunately, I don't manage to get a good result with the bar
function.
The stacked bar plot works well with positive values.
z=[1 2 3
4 3 1]
h = bar (z, 'stacked');
<https://octave.1599824.n4.nabble.com/file/t373739/bar_positive.gif>
And does not wok well with negative value. It seems the values are printed
on top of each other.
figure
z=[1 -2 3
4 3 1]
h = bar (z, 'stacked');
<https://octave.1599824.n4.nabble.com/file/t373739/bar_negative.gif>
Do you know a way to work around this?
Kind regards,
Olivier
--
Sent from: https://octave.1599824.n4.nabble.com/Octave-General-f1599825.html
The output is what I would expect to see (bar of height 1, overlaid with a bar of height -2, overlaid with a bar of height 3) so you only see the last bar. What are you expecting to see?Tony Richardson--Olivier Thomann
Hi Olivier,
Octave's stacked option appears to work differently than Excel. I prefer Octave's behavior (although it would be considered a bug
if it differs from MATLAB, I don't have MATLAB to check). It appears that you can get the plot you want by plotting the positive
and negative values separately:
z=[1 -2 3; 4 3 1]
zt = z;
zt(zt<0) = 0
h = bar (zt, 'stacked');
hold on
zt = z;
zt(zt>0) = 0
h = bar (zt, 'stacked');
hold off
zt = z;
zt(zt<0) = 0
h = bar (zt, 'stacked');
hold on
zt = z;
zt(zt>0) = 0
h = bar (zt, 'stacked');
hold off
Tony